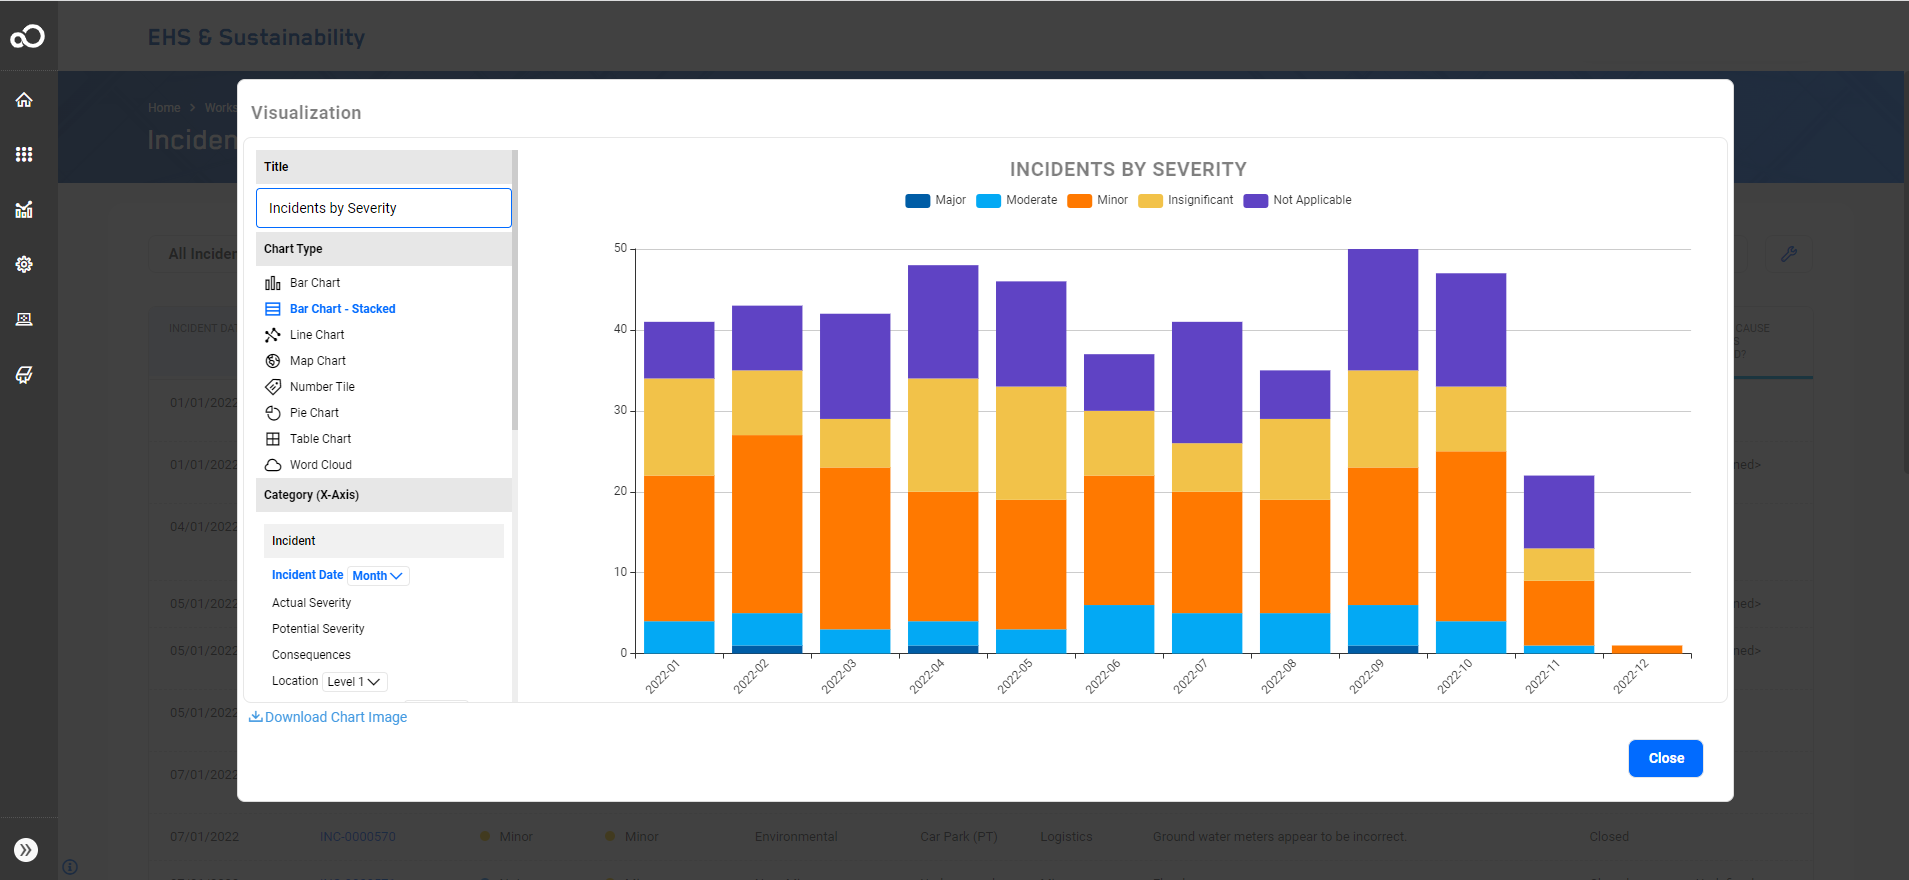
Visualizations from List ViewsVisualizations from list views allows end-users to easily undertake ad-hoc analysis, by instantly transforming any list view data into a visualization.
Users can click on the Visualize button in their list view which will open the Visualization canvas allowing them to build their charts quickly in this space. The below chart types are available:
Users can add new columns to the list views using the Add/Remove Columns which will be available in the Visualization canvass. One can also apply filtering on the list view columns, e.g., filter for Incidents in the past 12 months, which will reflect in the charts. One can download the visualization by clicking on Download Chart Image and the chart will be saved as a PNG image. Users will need to be granted the role "Policy Role – List View Visualization" to perform Visualizations from list view. For Administrators and Power users who wish to perform advanced visualizations, such as, creating charts with multiple data sources, applying color mappings, and more, they will need to have access to the Visualization Editor. Please refer to Visualizations. |
|||
|
Back to top |
 Copyright Evotix |