|
Visualizations
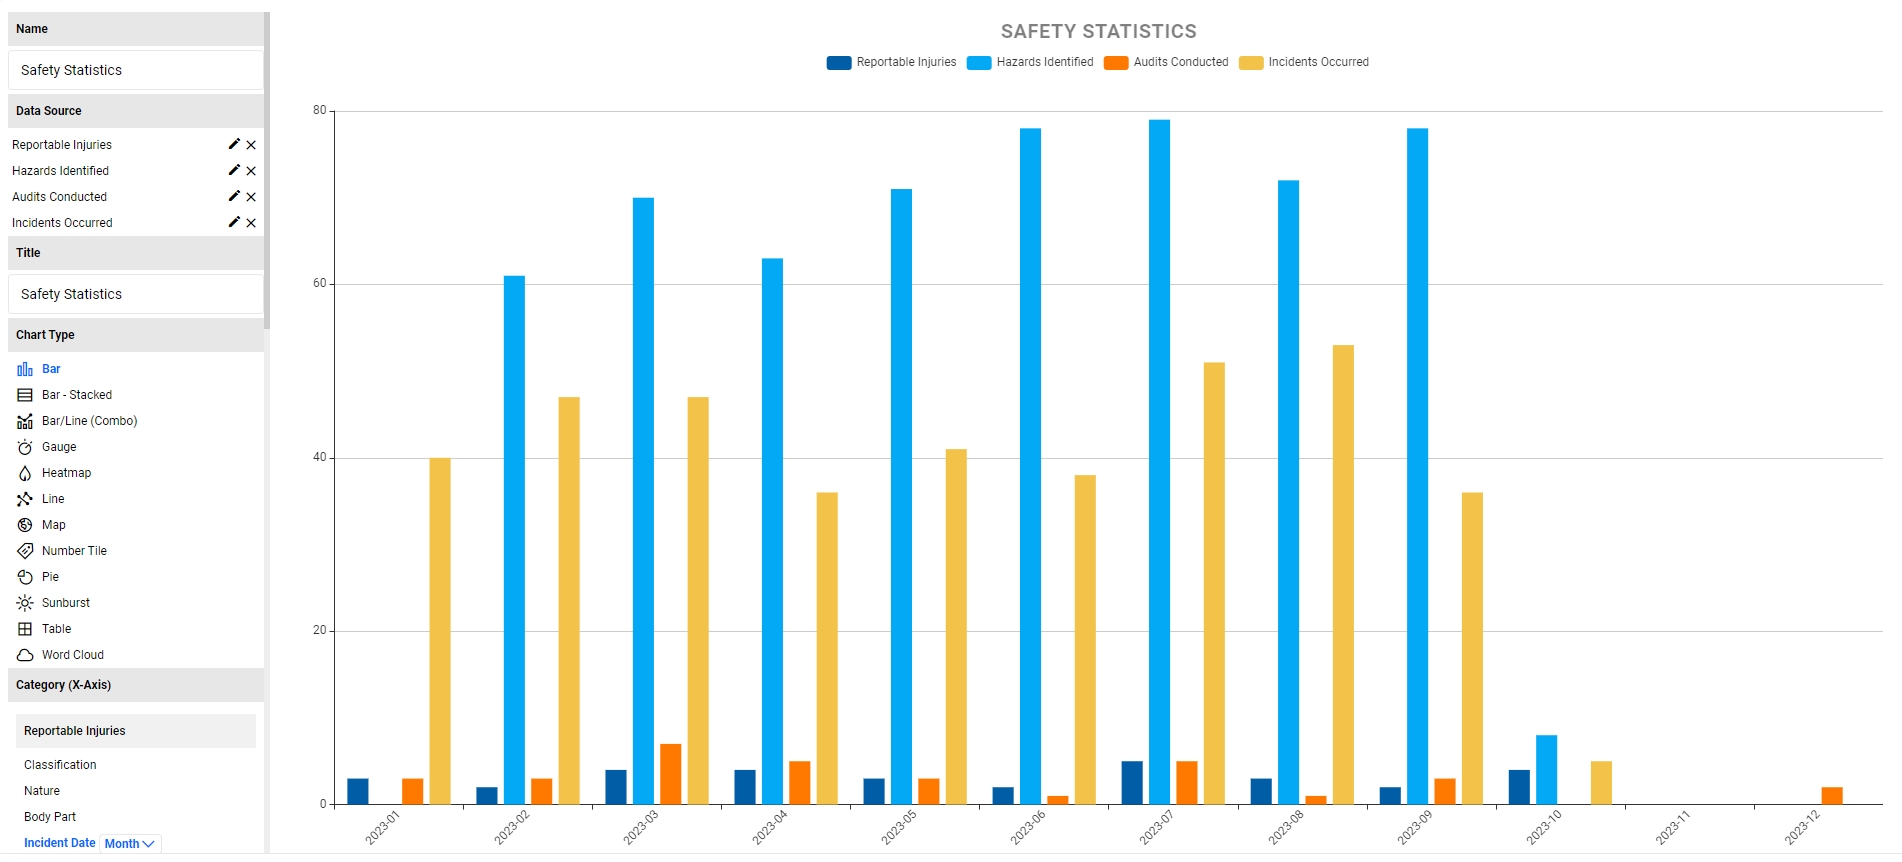
Visualizations empower end users by providing them with the ability to build their own charts and reports, facilitating a deeper understanding of the data and exploration of trends. It also allows power users to develop powerful cross-module, multi-data source BI dashboards, using live data and obeying the configured security model.
Users with the role Policy Role - List View Visualization will be able to perform simple visualizations from the list views and download the charts. Users will need to have an advanced role to be able to save the visualizations.
Administrators and Power Users who wish to perform advanced visualizations and save them will need to inherit the role Policy Role - Visualizations Admin.
They can access the Visualization editor by navigating to:
- Admin
 Visualizations Visualization Admin Visualizations Visualization Admin
This space will have a list of all the visualizations saved in the system. Clicking on the "Chart Name" will open that visualization in the editor where one can view and edit the chart as required. - Clicking on the "New" button will open the Visualization editor allowing the users to add in their data sources and start visualizing their data.
- Any List View and click on the Visualize button. In the canvas, click on Open in Editor which will load the Visualization Editor.
Visualizations respect the security configured for that process/component. Where a user does not have permissions or restricted permissions to view a record, the system will comply with those defined rules.
|
