|
Embedding Visualizations in Dashboards
You can embed Visualizations in dashboards. You will need Administrator permissions to access the dashboard designer. Please refer to Dashboard Designer.
When viewing the Visualizations in the dashboard, end-users will be provided with a "Analyze Further" link that will open a list view of the filtered data that constitutes the Visualization. If multiple data sources are involved, users will be presented with links to each data source list view.
Visualizations respect the security configured for that process/component. Where a user does not have permissions or restricted permissions to view a record, the system will comply with those defined rules when rendering a Visualization. However, when adding a Visualization to a dashboard, it can be setup to 'Override User Security' so that all users see the same data when viewing the dashboard.
How do I setup parameters for visualizations in a dashboard?
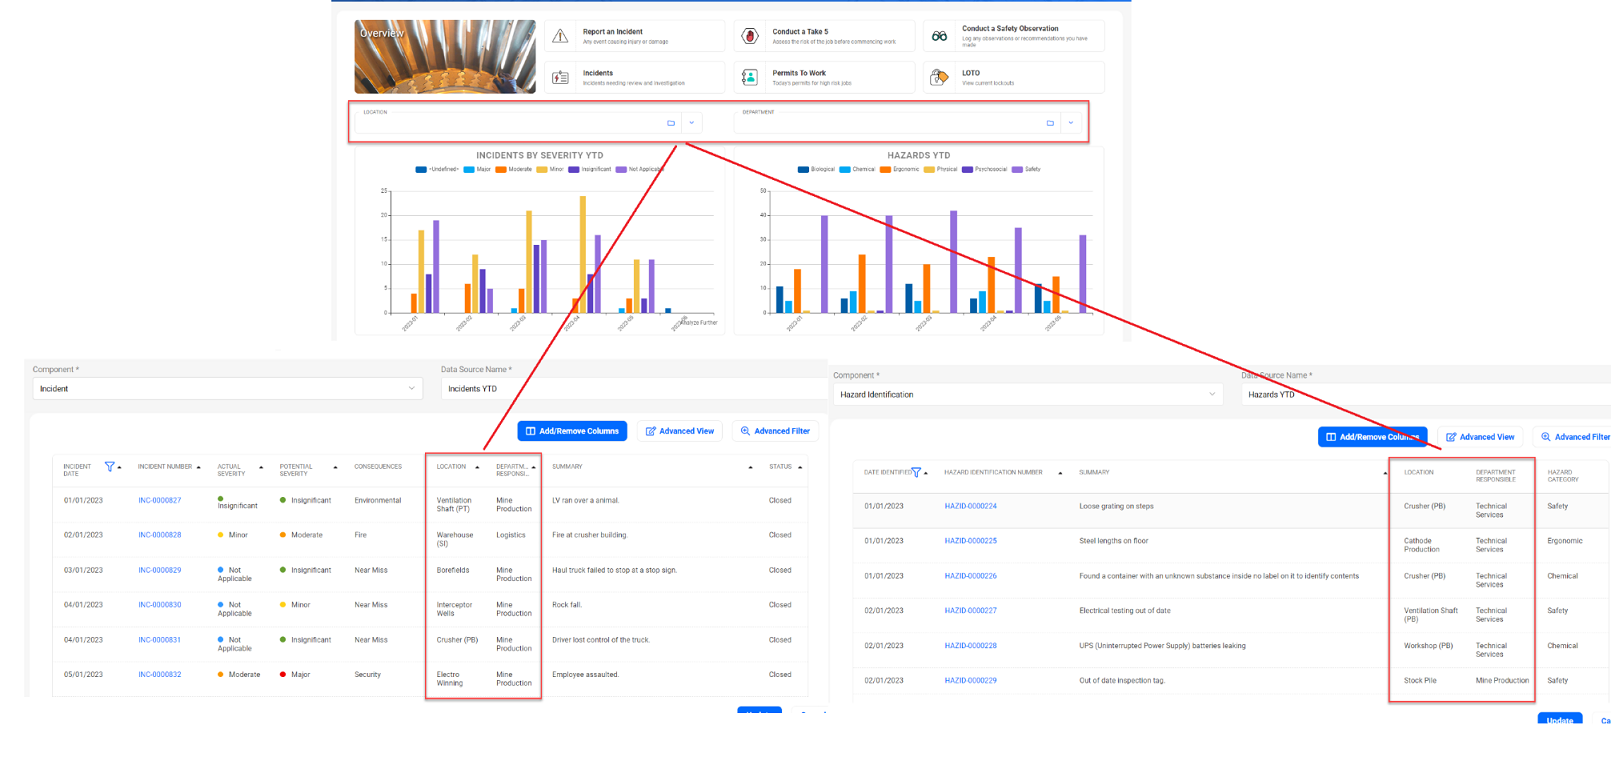
Once visualizations are embedded in dashboards, administrators can setup parameters (using one or more Visualization Parameter widgets) so that end users can filter the charts to analyze trends and gain insights.
To set Visualizations and Dashboard Parameters to work together, the key thing is to ensure that the component, lookup, questionnaire, or a date field used in the parameter is present in the data source as a column. If you have setup 'Location' as a parameter, then you need to ensure that the "Location" relationship is present as a column in the data source.
You can setup multiple parameters and the same rule applies.
There are four types of Visualization parameters that can be set up.
- Component
- Lookup
- Date Range
- Questionnaire
Type
|
Details
|
Component
|
This will render a component lookup selection field - typically for selecting things like a Location or Department.
OPTIONS
- Sub Type: Select from the list of components.
- List: Choose the list view you want to see for that component lookup.
- Defaults with Profile: Choose the profile value to default - will only show options of the selected component if configured in the Profile Settings.
- Selecting 'Allow Multiple Selection' will allow users to choose multiple parameter values when rendered in the dashboard.
|
Date Range
|
This will render two date pickers - a From and a To date - which defines the date range to be applied to the Visualizations.
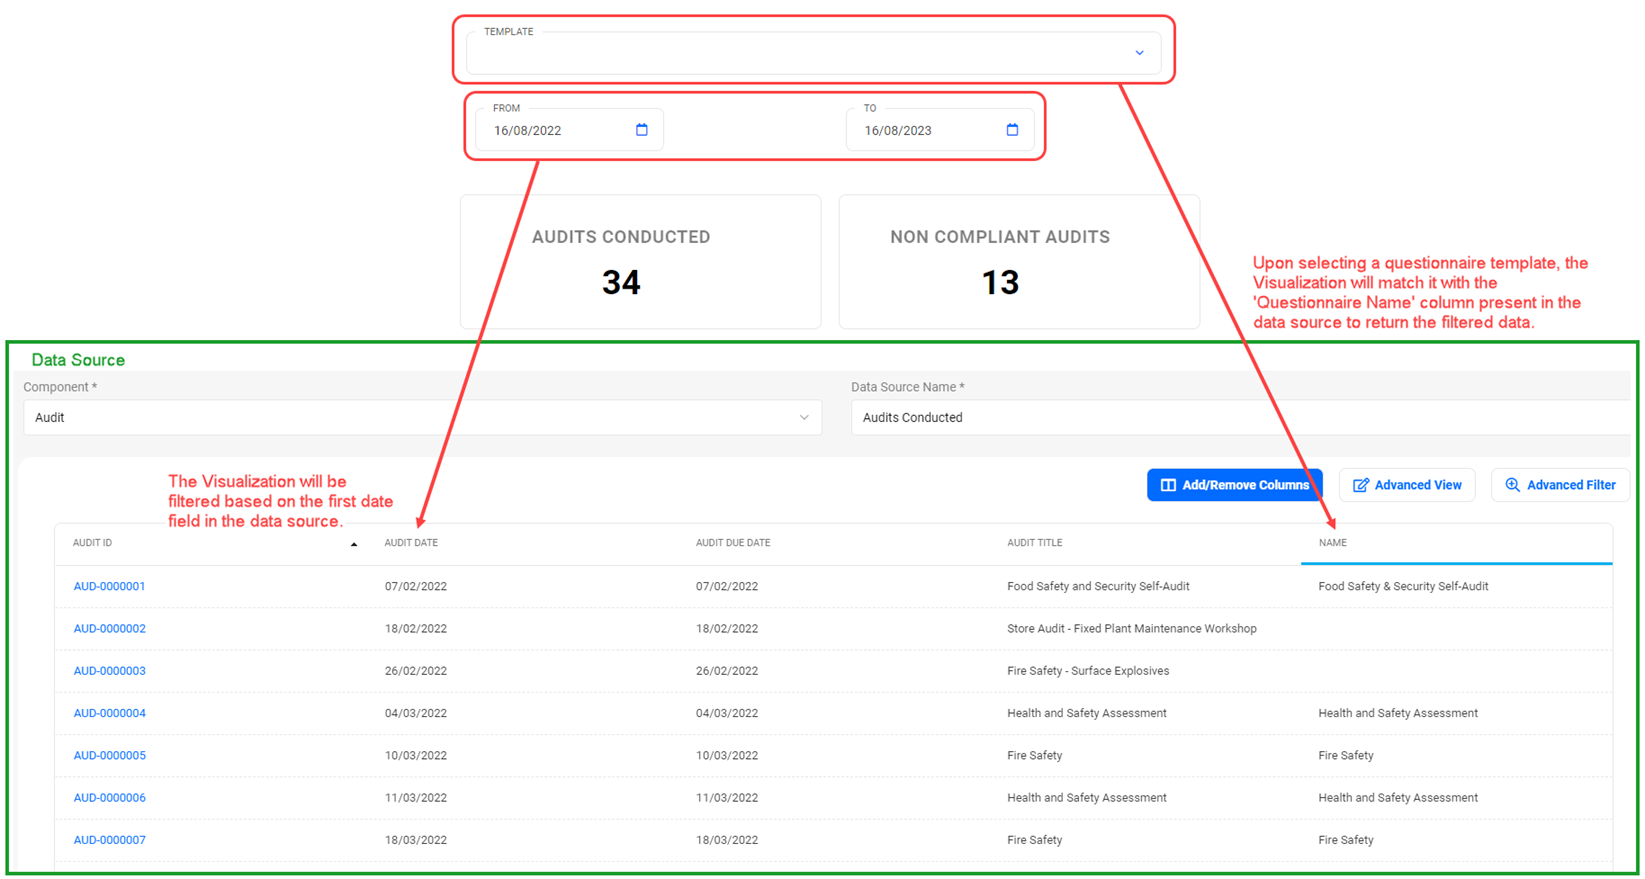
When the 'From' date is selected, the system will filter the records based on the first "Date" field in the data source (list view) and filter for records on or after the selected "From" date.
Similarly, when the 'To' date is selected, the system will filter the records based on the first "Date" field in the data source (list view) and filter for records on or before the "To" date.
OPTIONS
- Default From Date & Default To Date: You can select an option from the list of . E.g., TODAY_LESS_14.
If there are no defaults set, the system will not filter based on dates until a selection is made.
|
Lookup
|
This will render a lookup selection list.
OPTIONS
- Lookup: Select the lookup list.
- Selecting 'Allow Multiple Selection' will allow users to choose multiple lookup values when rendered in the dashboard.
The lookup field must be a column in the data source list view for the system to apply the filtering. Both single lookups and multi-lookups field types are supported
|
Questionnaire
|
This will render an unfiltered Questionnaire Template picker. You will need to ensure that the Questionnaire Name is present as a column in the data source for the system to apply the filtering.
Note: You can add the Questionnaire Name to the data source by using the Advanced View option, expanding the 'Questionnaire' relationship, and selecting the Name.
OPTIONS
- Keyword(s): Enter in one or more Questionnaire template keywords separated by semi colon. E.g. Inspection;Inspection_Facility.
The system will match the keywords defined in the parameter widget to the Questionnaire Template keyword and display the filtered questionnaire template list.
|
Example of a Dashboard filtered by Questionnaire template and Date Range.
|

