Using Dashboards

A Dashboard is a "collection" of multiple tables and charts. Depending on the configuration, these items

  • may be independent from each other
  • can ALL be filtered by a common "prompt".
  • are linked to each other, so that the selection of a value in one table/chart will influence the content of other tables/charts.

Dashboard setting

Available options

In any setting.

Any panel on a dashboard can be

  • expanded to "Full Screen" by double-clicking on the header of a panel.
  • reverted to the original size by double-clicking on the header again.

All tables and charts are independent.

You still can interact with each table and chart individually as outlined in the section "Using Analytics Reports".

Dashboard items can be filtered using a "Prompt".

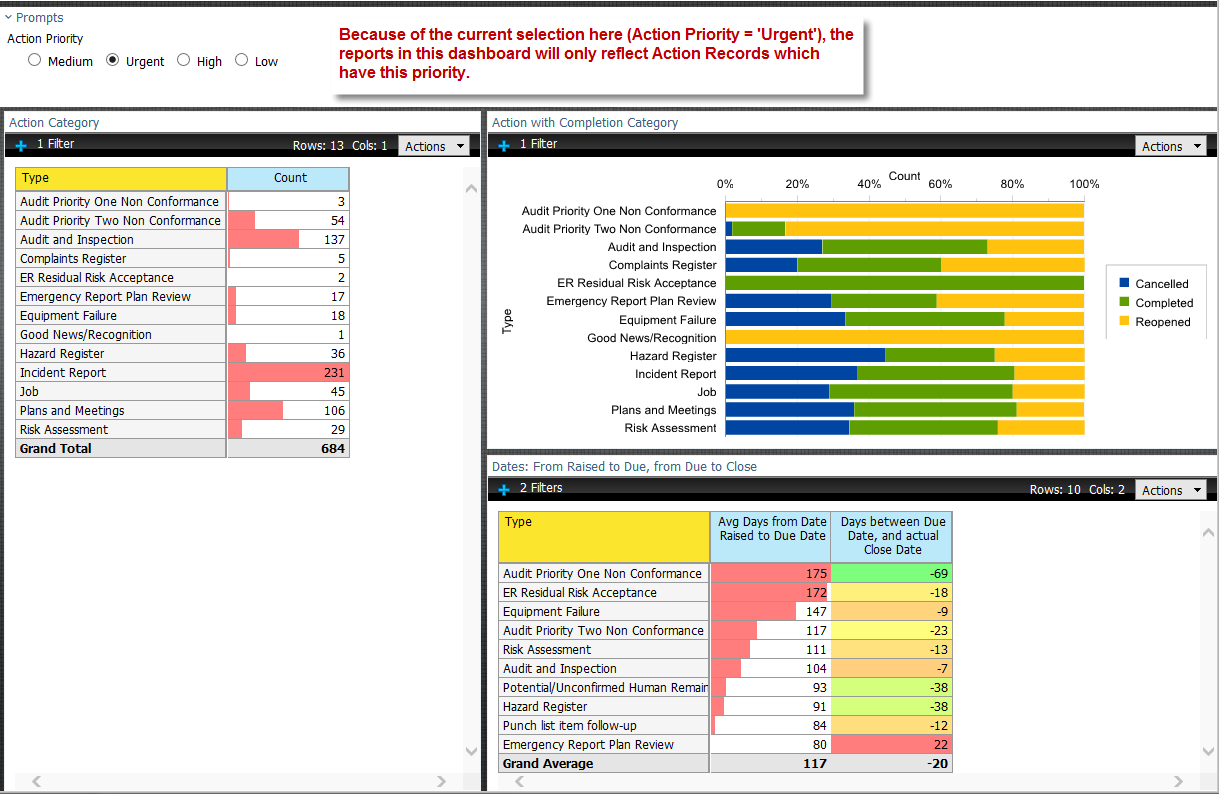
If a dashboard has been designed to apply a common filter across it's content, you will have a "Prompts" option.

The content of the various dashboard items will be filtered according to the selection the user has made.

This example shows "Actions" from different aspects, and the user has selected to only include Actions where the "Priority = Urgent".

Dashboard example 1 with prompt

Dashboard items are "linked".

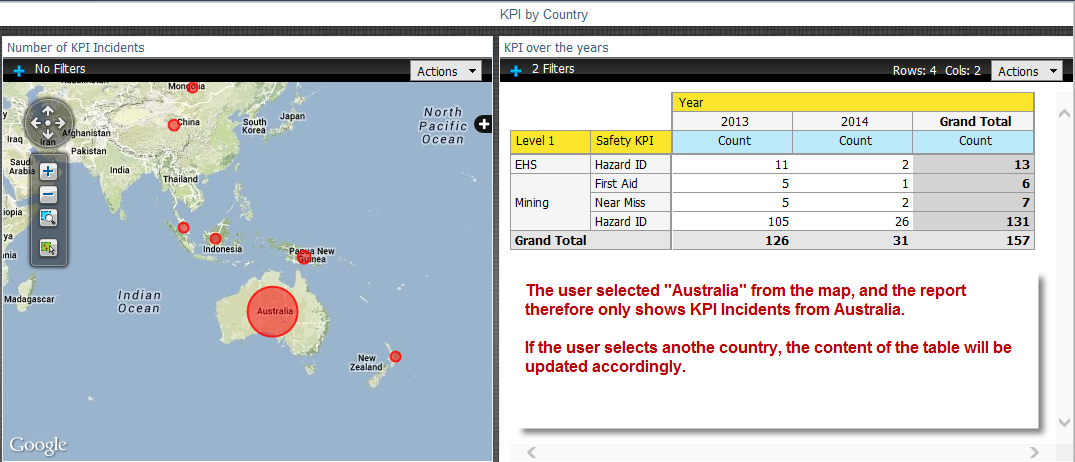
If a items in a dashboard are "linked", a user can influence the content of a linked table of chart by making a selection on the "Parent" table of chart.

This example shows the number of KPI Incidents on a map - the bigger the circle is, the higher the number of Incidents.

By clicking on any of the circles, the system will filter the content of the table to only show the KPI Incidents for this very country.

Dashboard example 2 with linking map to a table


See Also

Business Intelligence Reports for "Consumers"

Using Analysis Report

Using Interactive Reports

Using Reports which were created with the Report Designer (Complex Reports)