When using an Interactive Report, any user can interact with this report to "mold" it to their requirement, if necessary. These changes will only apply to the current session, and will not influence the base report.
If you want to ...
|
Perform these steps ...
|
Apply or modify a filter for the report.
|
There are several ways to apply a filter. One of them is:
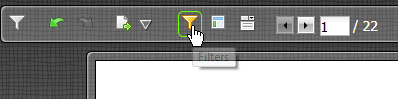
- While viewing a report, click on the Filter symbol. This will open the filter panel:
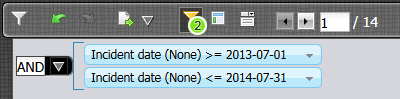
- You can drag and drop fields from the report into the filter panel, and define the filter as necessary.
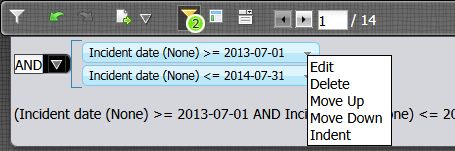
- To modify each entry, you can use the drop-down for each of the entries:
|
Change the layout of the report.
|
You can change the layout of a report in several ways. All these options are accessible by
- Clicking on the Layout symbol. This will open the layout panel:
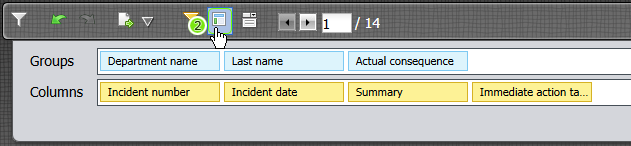
- By dragging and dropping, you can
- rearrange the Grouping Order
- change the order in which the columns are displayed
- move fields between Groups and Columns, so that a Column becomes a Group, or the other way around.
|
Use Prompts to allow users to dynamically filter the content.
|
You can add, or remove prompts from a report by
- Clicking on the Prompt Symbol:
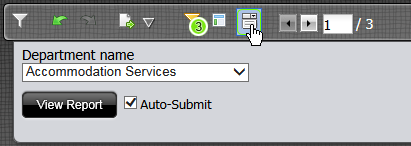
- Drag and drop a field from the report onto the panel, and the system will automatically create a prompt.
- You will need to select the filter panel to remove a prompt.
|
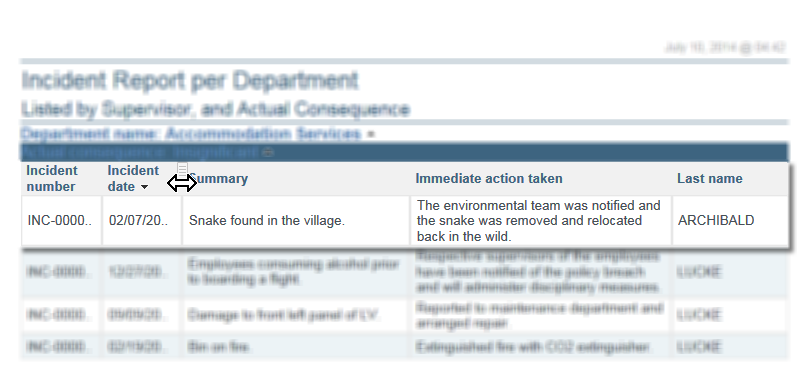
Change the width of a column
|
To change the width of a column, you need to:
- Drag the column divider on the TOPMOST column header on the report.
|
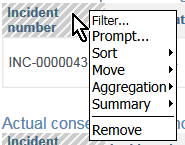
To perform various other actions ...
|
You can perform a range of actions for columns on a report by
- Right-clicking on a column, and then select the required step:
|
Save and export the report.
|
While it is not possible to save any of the above changes in the actual report format, you can export the report by:
- Clicking on the Export button
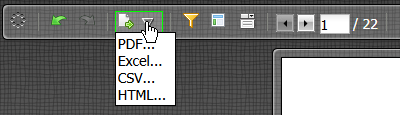
- and selecting the target format.
|
