|
Data Source for Interactive Reports
Introduction
In contrast to the Analytics Reports, Interactive reports are NOT based on Cubes, but rather on flat database tables. These tables are created as part of the ETL process, during which
- the tables
- and the columns in the table
will be named with real business names, instead of using the system names like for example "bms_9999999_107".
This will help report designers to identify and use the relevant information much easier than without this step.
Limitation in Data Security
In contrast to Analysis reports, and reports which are created via the Report Designer, it is not possible to control access to data in Interactive reports. ... If a user has access to an Interactive report, the system will show ALL records in the system.
The only way to apply security to Interactive reports is to limit WHO has access to a report.
Limitation in the Use of Related Data
While it IS possible to display related data in an interactive report, there are limitations in Interactive Reports due to the restriction to only ONE JOIN between two given tables.
For example, an Incident has multiple relationships to the Person table, lets say "Reported By" and "Responsible Supervisor".
Due to the limitation of only ONE JOIN between two tables (here: Incident and Person), a report designer
- will NOT be able to create an Interactive Report which shows BOTH, "Reported By" AND "Responsible Supervisor" - it can only be either of these values.
- WILL be able to include other relationships, for example the Department Responsible for an Incident.
Create a Data Source for Interactive Reports

|
Prerequisites
- You will need to be logged into BI User Console to perform any of the following actions.
- The ETL Process on the Evotix 360 database has already been performed.
- The user is aware of the name and location of the database which is created by the ETL process.
|

|
The information provided in this section is only high level. If you need more detailed instruction, please refer to the Pentaho Online Help.
|
If you want to ...
|
Perform these steps ...
|
Create a new Data Source for Interactive Reports.
|
In the user console,
- select Manage Data Sources
- create a new Data Source using the Data Source Wizard
- Name the source, using a name which will indicate what this source will contain.
- Select the Source Type = Database Table(s)
- Select the database connection which contains the ETL Output in your system.
- Select Create data source for: Reporting only
- Select Next
|
Report only on a single table (for example Incident), without any link to related data (like Persons, or Departments).
|
From the list of available tables, select the table which you want to use for your report.
HINT:
the database will contain MANY tables. The tables of interest will start with "rt_", for example "rt_incident".
|
Create a report which does include related data, for example "Reported by" and "Department Responsible" for an "Incident".
|
To create Interactive Reports which include relational information, you will need to
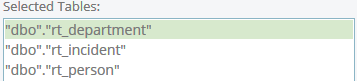
- select ALL the tables you need for the required information.
In this example, you would select:
- In the Next step, you will need to create the links ("Joins") between the different tables. The rule is that:
- the MAIN data (here Incidents) will be the Left Table, whereas all the RELATED information (here Person and Department) will be on the Right Table.
- Identifying the fields on the
- Left Table:
look for fields with a prefix of "dwk_" (data warehouse key, which is a foreign key). In this example, the field is "dwk_reported_by".
- Right Table
look for fields beginning with "dwi_" (data warehouse identity, which is the primary key). In this example, the field is "dwi_person".
- select "Create Join"
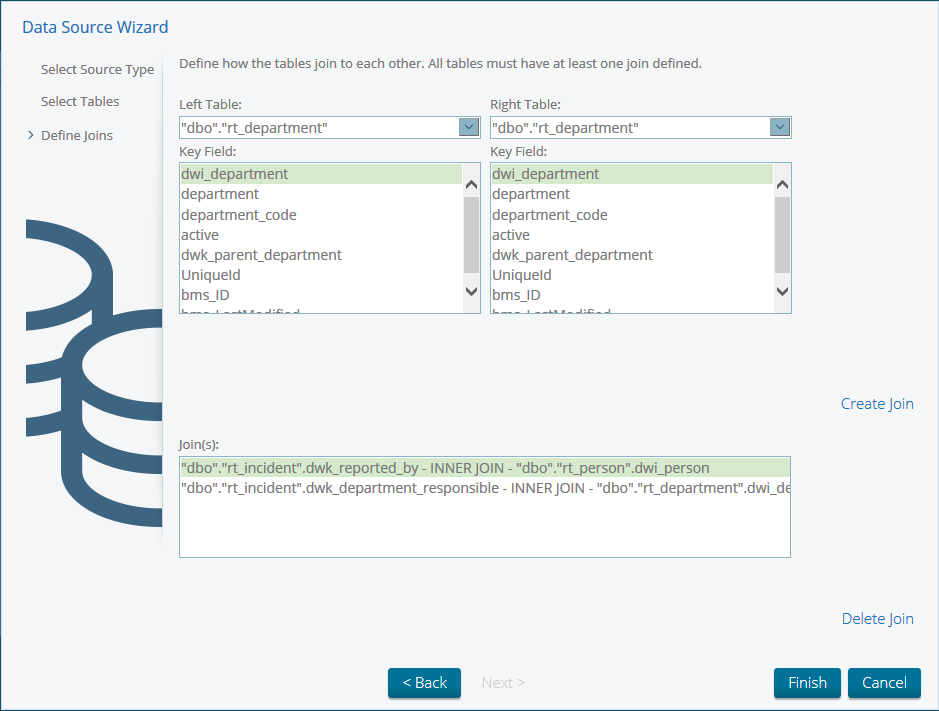
(The above-mentioned limitation of "one join between tables" would mean that, in this example, you could not add another link between rt_incident and rt_person, for example using the field dwk_person_signing_off.)
- Repeat steps until all the necessary joins have been created, and then click Finish.
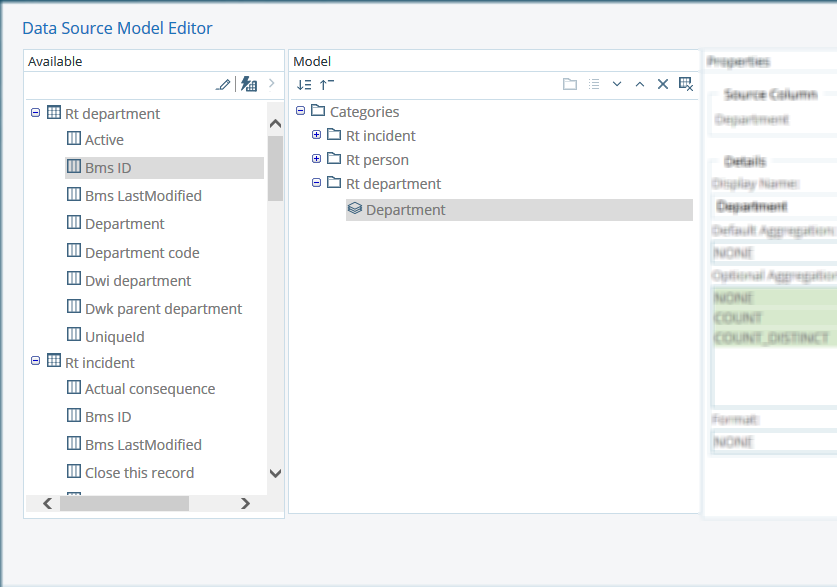
This will generate the Data Source Model.
- The fields shown in the Model will be those available for use in the Interactive Reports. You can leave the generated Model as is, or you can make some changes in the Model Editor, for example:
- Remove fields from the Model, so that only "relevant" fields are shown when building a report.
- Adjust field properties, for example changing the display name:
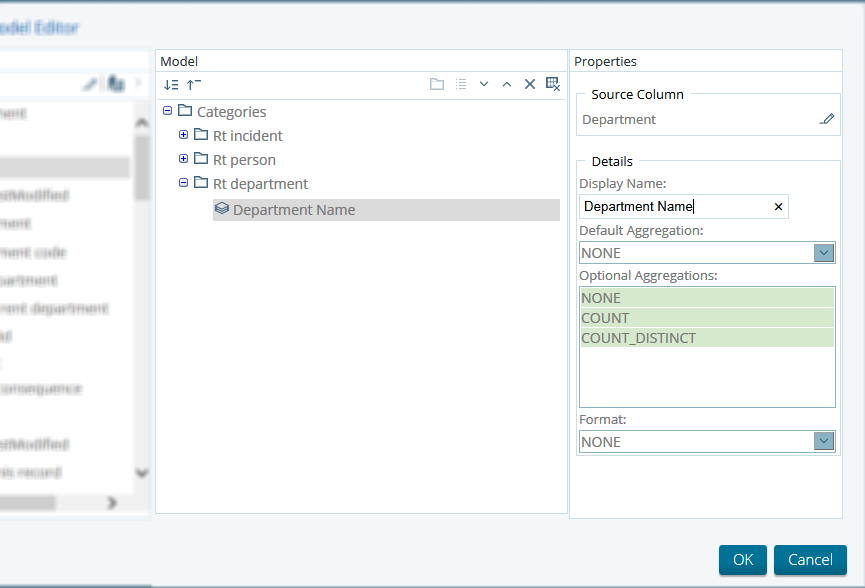
- Once finished, press OK
|
|
