If you want to ...
|
Perform these steps ...
|
Create a new Analytics Report
|
In the BI User console
- Select File
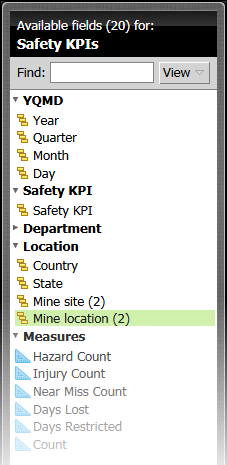
 New Analysis Report New Analysis Report - In the Data Source Selection Window, select the correct source for your new report.
(The list of available sources will be different from client to client). - Once done, the system will display a list of all fields which are available in the selected data source (Cube).
|
Change order in which fields are listed.
|
You can change the order in the list of available fields by clicking on the View button.
If there is a large number of fields, you can filter them by typing the search term into the Find field.
|
Select the intended output format.
|
While it is possible to change the layout of the report (being a table, or a different chart type) at any time, it is suggested that you select the type at this point.
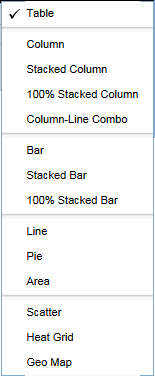
The reason is that the content of the Layout Panel, which you will need in the next step, will depend on the report/chart type.
|
Add fields to the report.
|
You can gradually build your report by dragging the required fields into the Layout Panel.
By simply dragging and dropping it is possible to
- move field around,
- or to remove them from the report altogether again by dragging them back to the Field Selection List, or to the virtual "waste basket" which will become visible in the bottom right corner.
|
Apply specific properties, or Report/Chart Options.
|
At any time, you can modify
- the properties of the current report. The available properties will depend on the current output format.
- The Report or Chart Options.
|
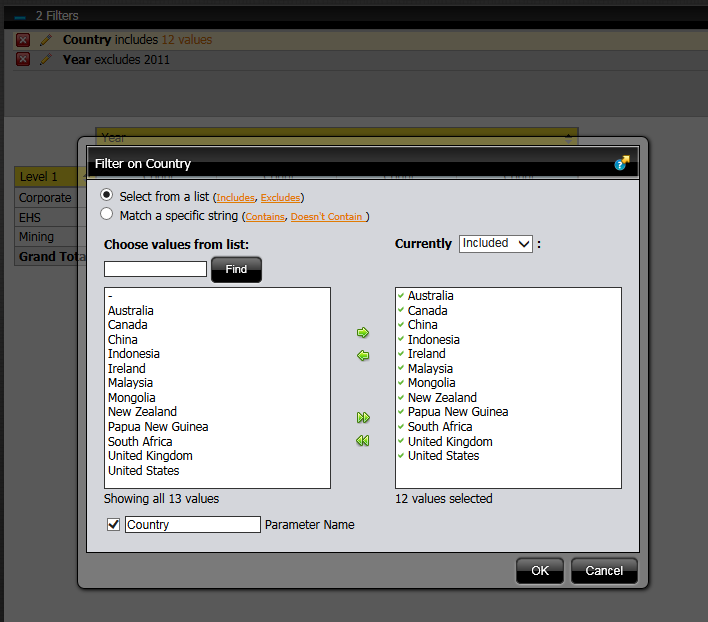
Add a Filter to the Report
|
To filter on a field, you can drag the field into the Filter panel, and then define the details.
If you intend to use the report within a BI Dashboard which is either "linked", or is using "prompts", you will have to define a Parameter Name.
|
Use Geo Mapping
|
If the intention is to apply Geo Mapping, i.e. to represent records on a map, it is necessary that the system is set up correctly, so that the required information can be extracted.
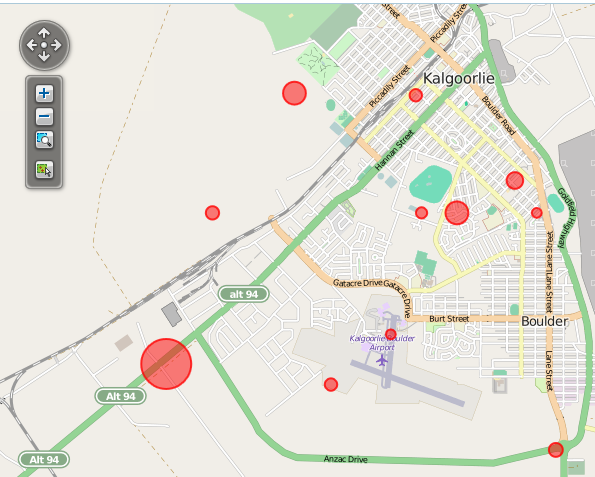
Please follow this link for further details.
|
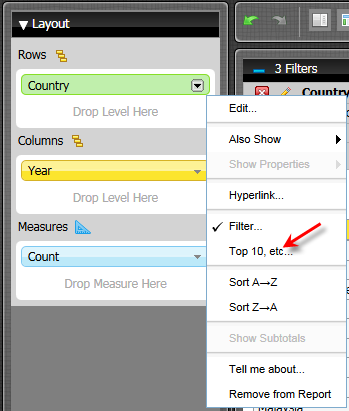
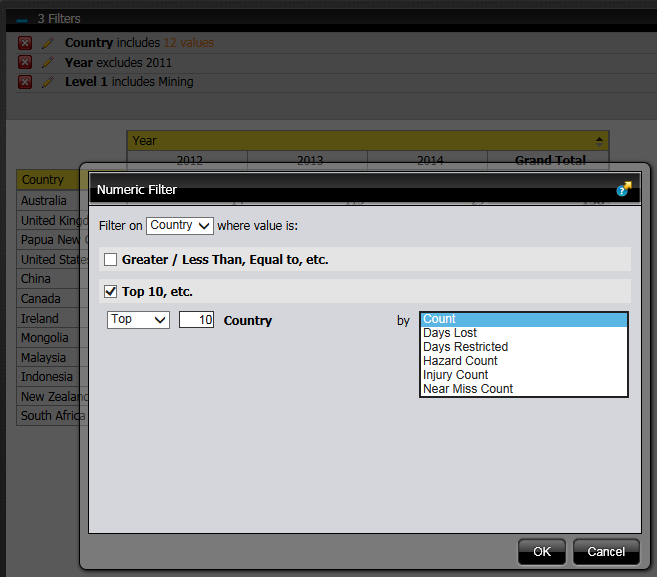
Apply a numeric Filter to a Column or Row
|
For each level of a report (the fields which are represented as rows or columns), it is possible to apply a numeric filter:
- Greater / Less Than / Equal to ... etc.
- Top or Bottom 10, etc.
Open the drop-down for the field in question, and define your filter as necessary:
|
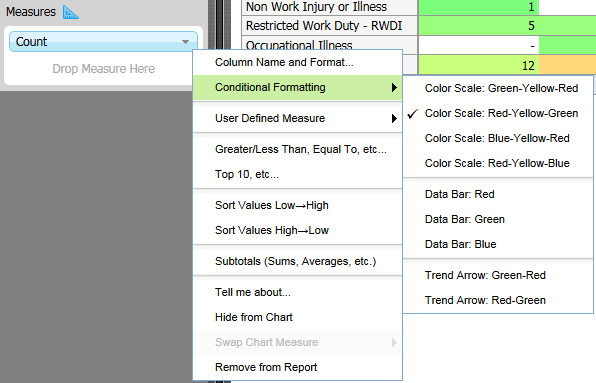
Apply conditional formatting to a Measure.
|
In some instances it can be helpful to apply conditional formatting, for example to visually highlight the highest/lowest numbers in a table.
For the Measure in question, open the drop-down Conditional Formatting and select the required formatting.
|
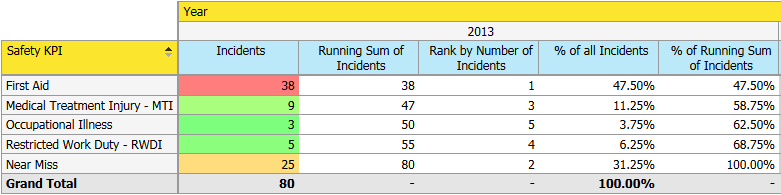
Calculate % of, Rank, Running Sum for a Measure.
|
For each Measure it is possible to apply a range of predefined calculations. To do so, select the Measure User defined Measure % of, Rank, Running Sum.
For detailed information, please refer to the Pentaho online help:
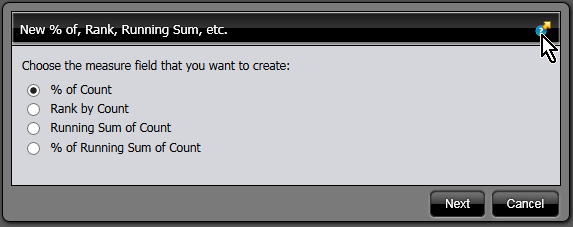
This is an example where some of these calculated measures where applied:
|
Apply calculations to Measures
|
For each Measure it is possible to apply a range of user defined calculations. To do so, select the Measure User defined Measure Calculated Measure.
For detailed information, please refer to the Pentaho online help:
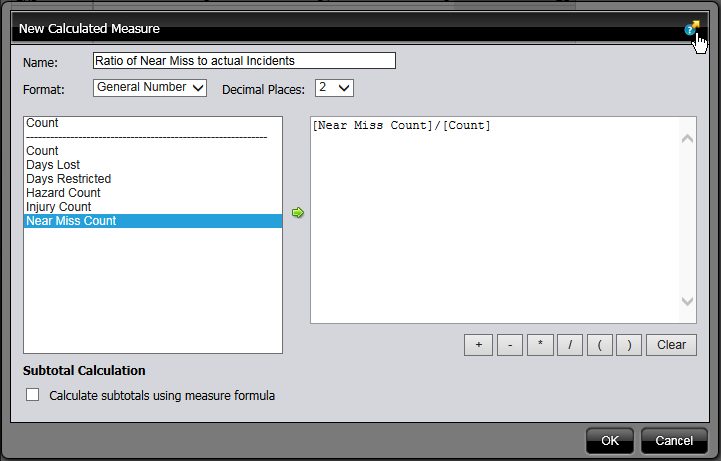
Example with a calculated measure:
|
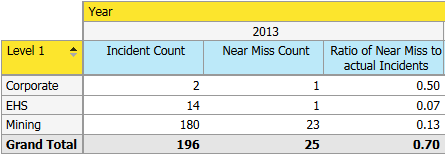
Apply Trend Measures
|
For each Measure it is possible to apply a range of Trend Measures. To do so, select the Measure User defined Measure Trend Measure.
|
Calculate Average, Max, Min etc.
|
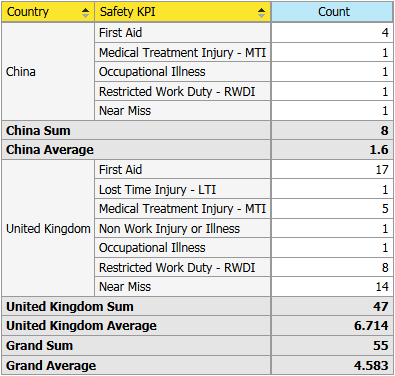
For each Measure it is possible to calculate subtotals. To do so, select the Measure Subtotals (Sums, Averages, etc.):
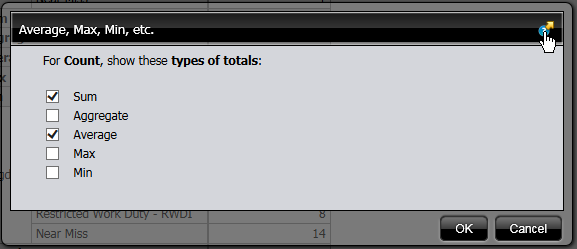
Example with subtotals:
|
Save the report, and make it available for use.
|
To make the report available in Evotix 360 for 'End Users', you will need to save the report. When you save the report, you can control if the report will be accessible for yourself only, or for a wider user group.
- Report is for own use only:
If no-one else but a certain user is to have access to this report, you can save the report to the path:
"Home/<User Name>".
- Report is publicly available:
To allow access to a report by many users, you can save it to the path:
"Public/e360/<Folder Name>/<File Name>"
|

