If you want to ...
|
Perform these steps ...
|
Create a new Interactive Report
|
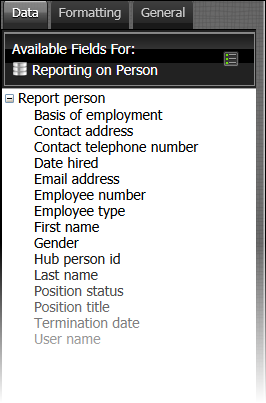
In the BI User console
- Select File
 New Interactive Report New Interactive Report - In the Data Source Selection Window, select the correct source for your new report.
(The list of available sources will be different from client to client). - Once done, the system will display a list of all fields which are available in the selected data source.
|
Optional: create a filter
|
If your data source contains a large number of records, it is highly advisable to first create a filter, which will only return a limited number of records, before configuring the layout of the report.
To create a filter, please check below.
|
Add a field to the report columns.
|
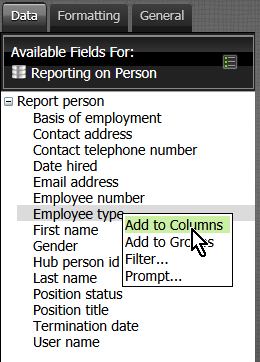
To add a field to a column, you can either
- drag and drop the required field onto the canvas
- right-click on the field in the list of fields, and select Add to Columns.
- You can re-arrange the order of the fields by clicking on the field header, and dragging the field into the desire position.
|
Add a Group to a Report.
|
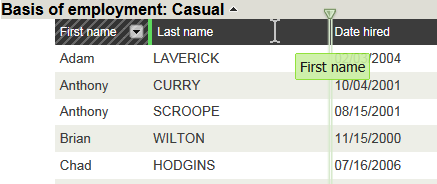
You can group the data on the report, if necessary on several levels. To add a field to Groups, you can
- drag and drop a field above the columns
- right-click on the field in the list of fields, and select Add to Groups.
|
Add a Filter to a Report.
|
You can add a filter to a report by either
- drag and drop the required field to the filter panel
- right-click on the field, and select Filter
- define the details of the filter in the filter builder.
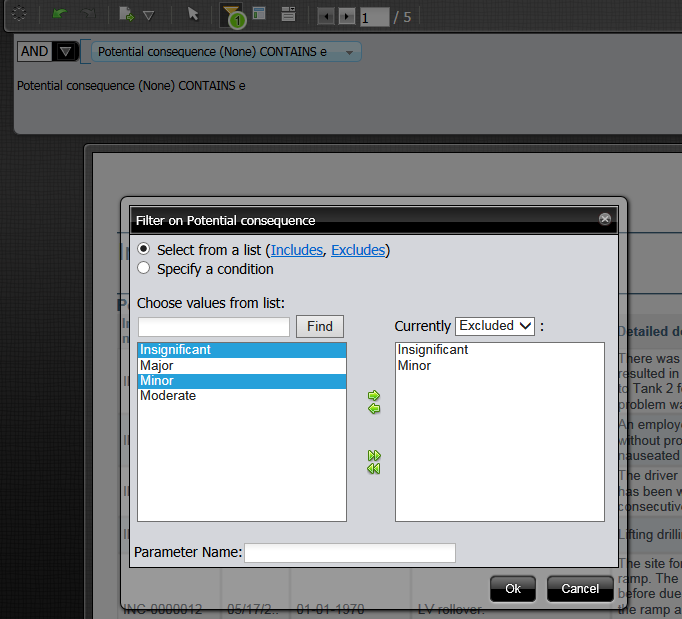
- You can apply more complex filters by using AND, OR, and even indentation to structure your filter.
|
Add a Prompt to a Report.
|
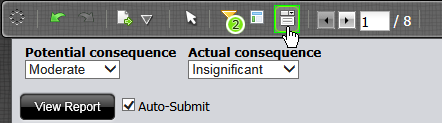
Whereas filters are "static", adding prompts to a report gives users a more dynamic means of filtering the content of a report.
To add a prompt
- To add a prompt, right-click on the required field to add it to the filter panel.
- you can add multiple prompts, which by default will be AND-ed together. This means the system will only show records which meet ALL the parameters.
- To change the logical operator, you will need to access the Filter panel and change it.
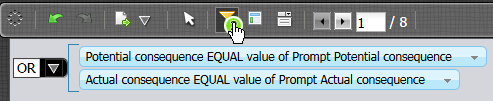
- To again show the prompts, you will need change to the Prompt view:
|
Format individual aspects of the report.
|
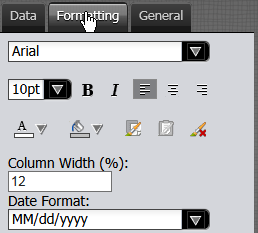
You can change
- fonts, background and foreground colors for individual parts of a report, for example Group Headers, Column Headers, or individual cells.
- the date format of individual columns. To do so, you need to click on one of the Values rather than on the column header, and then apply the correct formatting using the Formatting tab.
- If you want to add or remove Date Formats from this selection, you can do so by modifying the file
message.properties, which is located in:
C:\Pentaho\server\biserver-ee\pentaho-solutions\system\ pentaho-interactive-reporting\resources\messages\
New Entries into this list must be of the following format:
Editor_DATE_FORMAT_LABEL_[number]=[Label] Editor_DATE_FORMAT_[number]=[Format]
For example:
Editor_DATE_FORMAT_LABEL_1=Date (DD/MM/YYYY)
Editor_DATE_FORMAT_1=dd/MM/yyyy
- Please make sure to use valid format strings (which are case sensitive!)
|
Apply a pre-defined template to a report, and/or change the page settings.
|
If you want to apply one of the predefined templates to a report, select the tab General, and either:
- Select the required template
- or perform a Page Setup
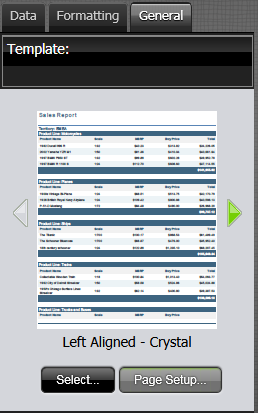
- One of the options is "Dashboard", which will render the report without pagination. This will allow for easier viewing if a report is embedded in a dashboard.
|

