Conditional Formatting of Data

In some cases it is helpful to visually emphasize individual records or values in a report, in order to draw the users' attention to it. For example, when a numeric threshold is exceeded, then this record needs to be highlighted in red.

The Report Designer offers various ways to easily define such conditions, as outlined below.

If you want to ...

Perform these steps ...

Conditional Formatting of Data.

The Report Designer offers an easy way to apply conditional formatting - i.e. change aspects of the display attributes which depend on the current value.

  • Sample Requirement:
    If the number of Incidents for a certain "Potential Consequence" exceeds 50, then highlight these entries via
    - a change in color
    - setting the font to bold
    - increased font size
  • Sample Solution:
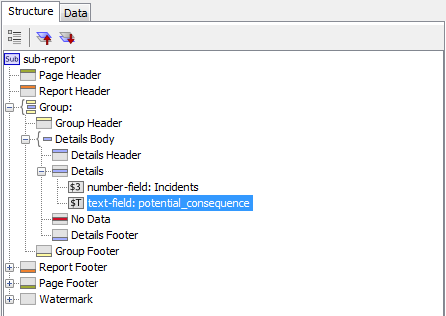
    - In the "Structure" pane of the Report Designer, select the field in question:

    Report Designer - Structure Pane selecting a field

    - In the "Style" pane, select the Attribute in Question and click on the "+" to create a new rule:

    Report Designe - Style pane selecting new rule

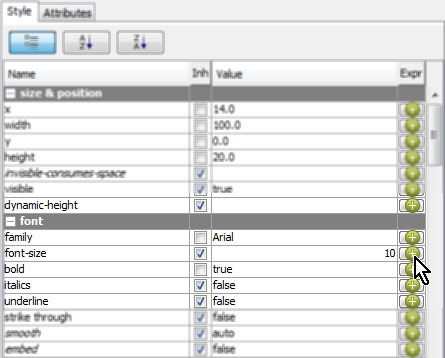
    - Define the rule, for example font size:

    Report Designer - Expression Builder for font size


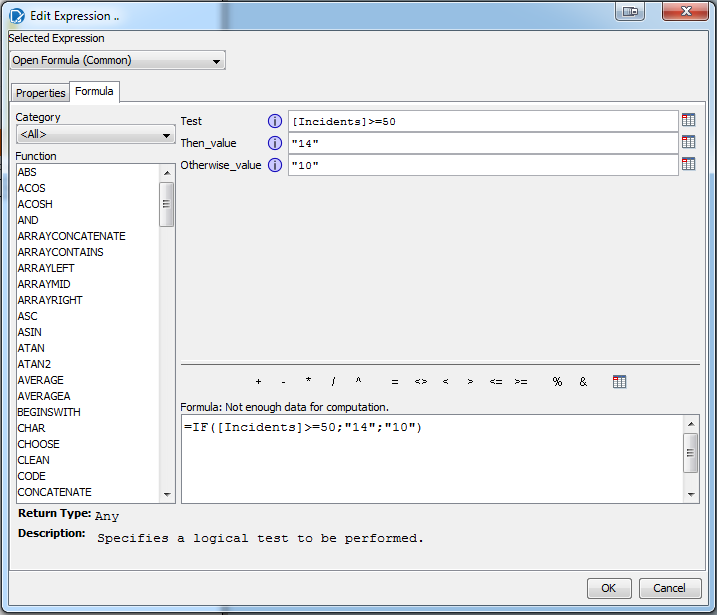
    - The equivalent value for the font color could be:
    =IF([Incidents]>=50;"red";"black")

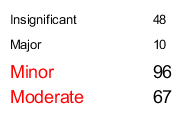
    - The result would be:

    Report Designer - sample for conditional formatting

See Also

Use of the SAI360 BI Report Designer

Using Database Tables as Source

Using Cubes/Schemas as Source

Building a Report - Using Parameters

Using SAI360 Parameters for BI Reports

Building a Report - Showing Related Data in Sub-Reports

Hyperlinks to SAI360 in BI Reports

Including Images in a Report

Including "Sparklines" into a Report

Use of Profile Values in a Report

Internationalization/Localization of Reports