|
Including "Sparklines" into a Report
This section will cover "Sparklines".
From a data point of view, the biggest difference is that Sparklines need a CSV List, rather than a normal result-set. In here we will explain how you can convert a SQL list into comma separated list, and how you can include a sparkline in your report.
What are Sparklines?
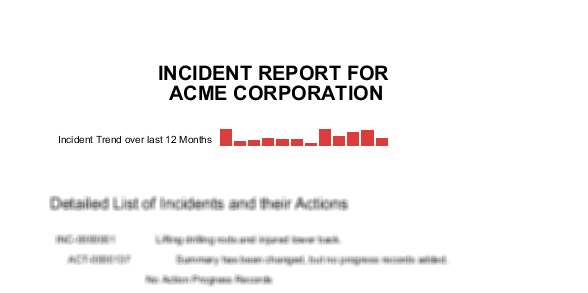
Here is an example of a Sparkline
This following definition is directly taken from Wikipedia:
|
"A sparkline is a very small [...] chart, typically drawn without axes or coordinates. It presents the general shape of the variation (typically over time) in some measurement, such as temperature or stock market price, in a simple and highly condensed way.
Sparklines are small enough to be embedded in text, or several sparklines may be grouped together as elements of a small multiple.
Whereas the typical chart is designed to show as much data as possible, and is set off from the flow of text, sparklines are intended to be succinct, memorable, and located where they are discussed."
|
Types of Sparklines
Three different types of sparklines are on offer:
To display
|
Select Type
|
A trend, which consists of several numbers/an array
|
To display a trend, you can either select a:
- Bar-sparkline:

- Line-sparkline:

|
A single value.
|
To display a single value, and indicate whether this value is considered low, medium or high, you can select a:
- Pie-sparkline:

|
Implementing Sparklines which show a Trend (Line- or Bar-Sparkline)
Required Task
|
Steps to be performed
|
Create a CSV list to display a Trend as a Sparkline
|
Sparklines need a comma separated list of values (CSV) to display values.
Therefore, it is necessary to convert the result-set of an SQL script into an array. The implementation varies, depending on the database in use.
The 'generic' script for an MS-SQL database is:
SELECT STUFF (
(<Your Select Statement to retrieve the Data>)
FOR XML PATH('')),1,0,'') as <alias>
(The correct code for ORACLE will follow later - sorry if this is causing any inconvenience.)
- Sample Requirement
Create a sparkline which shows the number of Actions which were raised in each calendar-month.
- Solution (for SQL)
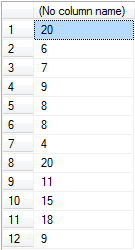
- First create and save the correct SQL script to retrieve the data from the database, for example:
SELECT COUNT(*)
FROM dbo.rt_action
GROUP BY month(date_raised)
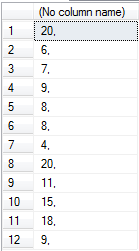
- In the next step, you will need to convert the resulting numbers into a varchar format, and also include a ',' in the set:
SELECT CONVERT(varchar(2),COUNT(*))+','
FROM dbo.rt_action
GROUP BY month(date_raised)
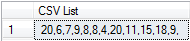
- Finally, you will use the STUFF command to convert the result-set into a CSV list:
SELECT STUFF (
(SELECT CONVERT(varchar(2),COUNT(*))+','
FROM dbo.rt_action
GROUP BY month(date_raised)
FOR XML PATH('')),1,0,'') as 'CSV List'
|
Create a Sub-Report
|
To include a Sparkline
- Create a Sub-Report
- When asked, select the script you saved in the previous step for the Sub-Report.
|
Add the Sparkline
|
Drag the required Sparkline into the Details panel, and then
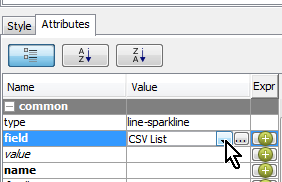
- Click on the Sparkline control on the canvas
- Select the Attributes Tab
- As the Field, select the Alias you defined in the script:
- Format the Sparkline as required (please check Pentaho Documentation for details).
|
Implementing Sparklines which "evaluate" a Single Value (Pie-Sparkline)
Pie-Sparklines can assist in a quick evaluation of how a single number rates against a set target.
To use Pie-Sparklines
- the number which is passed to this sparkline must be between 0 and 1 (inclusive)
- you can define up to three color coded "levels":
- Low  shown as green shown as green
- Medium shown as yellow
- High shown as red
Required Task
|
Steps to be performed
|
Create a script which will returns a single value of between 0 and 1.
|
Most likely you will need to establish a "target" value - or a normalization against which you can compare the current value which is returned from the data-set.
The "only" requirement is that the resulting value must be between 0 and 1.
|
Create a Sub-Report
|
To include a Sparkline
- Create a Sub-Report
- When asked, select the script you saved in the previous step for the Sub-Report.
|
Add the Pie-Sparkline
|
Drag the required Sparkline into the Details panel, and then
- Click on the Sparkline control on the canvas
- Select the Attributes Tab
- As the Field, select result which is returned from the above script:
- Define the low-slice, medium-slice and high-slice, for example:
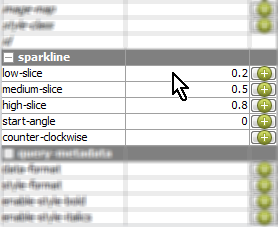
The result of this example will be when the value is:
- <= "low slice" (<= 0.2)

- <= "medium slice" (<= 0.5)

- >= "medium slice" (>= 0.5) AND <= "high slice" (<= 0.8)

- > "high slice" (> 0.8)
Value will be ignored.
|
|
