It is also possible to build reports in the Report Designer which are based on Cubes/Schemas.
The advantage of this approach is that a designer can "quickly" generate the data which will be necessary for a report in the Analytics Tools, and then apply some formatting or other measures in the Report Designer.
If you want to ...
|
Perform these steps ...
|
Generate the MDX script for the Report.
|
The steps are as follows:
- Using the BI User Console, create an Analytics Report which contains the required data.
- From the Menu, click on the cog-icon ("More Actions and Options"), and select Administration
 Log. Log.
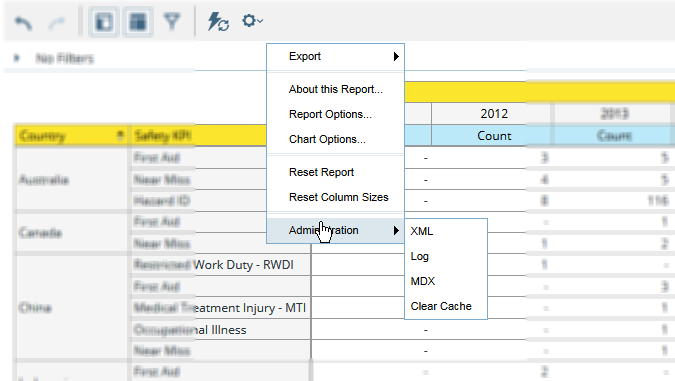
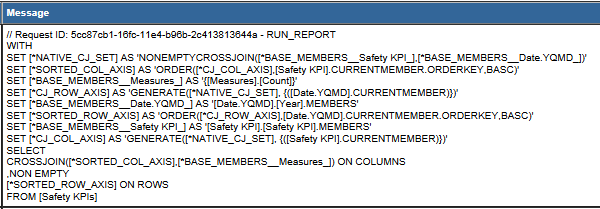
- From the "Message" column, select and copy the MDX script, which could look like this example:
|
Start the Report Designer
|
To access the Report Designer, select:
Start All Programs Pentaho Enterprise Edition Design Tools Report Designer.
To create a new report, select File New
|
Define the Source of the Data
|
To select a Data Source, you need to right-click on the Data Sets.
In the Pentaho Report Designer can select from a range of Data Sources. For reports based on Cubes/Schemas, please select:
- OLAP Pentaho Analysis:
if you intend to use MDX scripts (generated in the Analytics Tool) to generate Data for the Report.
|
Use Cubes/Schema to retrieve Data
|
To retrieve data via a Cubes/Schemas, you will need:
- have added a DB Connection: please check here for details.
This connection can be re-used for all reports which are based on the same database.
- In addition, you will also need to define the Schema which is the base for the report. In the Data Source Window
- Browse for the location of the Schema's XML file, and once selected
- click Update Schema Name
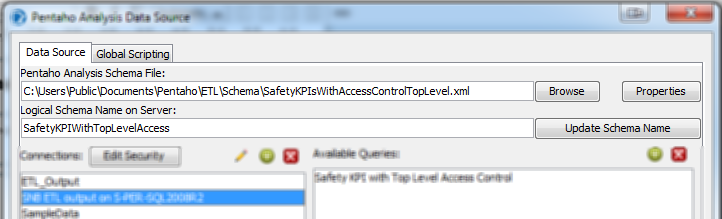
- Make sure to select the correct Connection.
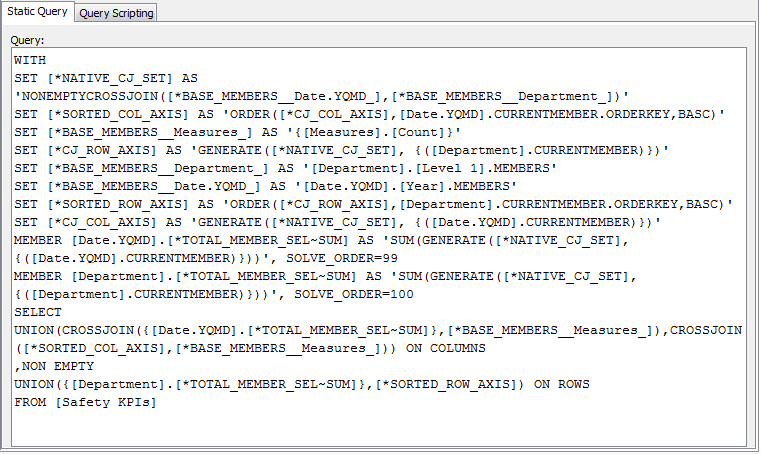
- add a new Query, and Paste the MDX script from the first step:
|
Design the format and layout of a report.
|
Please refer to the information which is accessible from within the Pentaho Report Designer.
|
Publish Report to Evotix, so that it can be used in the Web Application
|
Once a report has been defined and is ready for use in the Evotix Web Application, it needs to be "published" to the BI Server. To do so:
- Open the report in the Report Designer
- Select File Publish
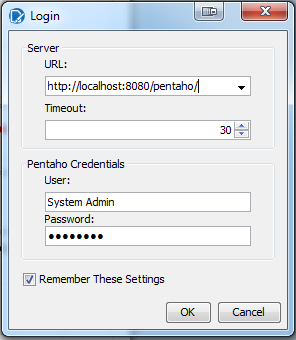
- The first time you do this in the Report Designer, you will need to enter the URL and BI Credentials. Make sure to tick "Remember These Settings":
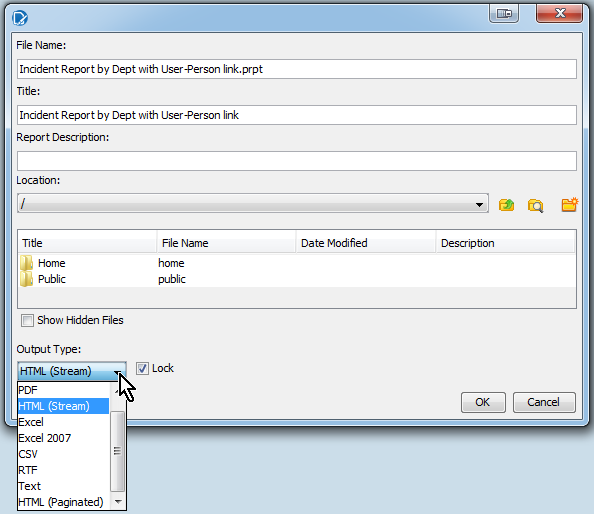
- Enter the Publish Details for the report:
- File Name/Title/Report Description: self explanatory
- Location: select the folder into which the report shall be placed
- Output Type: select the (default) format in which to render the report.
- Lock: if you tick this box, the user will NOT be able to select alternative Output Type when the report is being run in Evotix.
|

