|
Retrieving Information using Dashboards
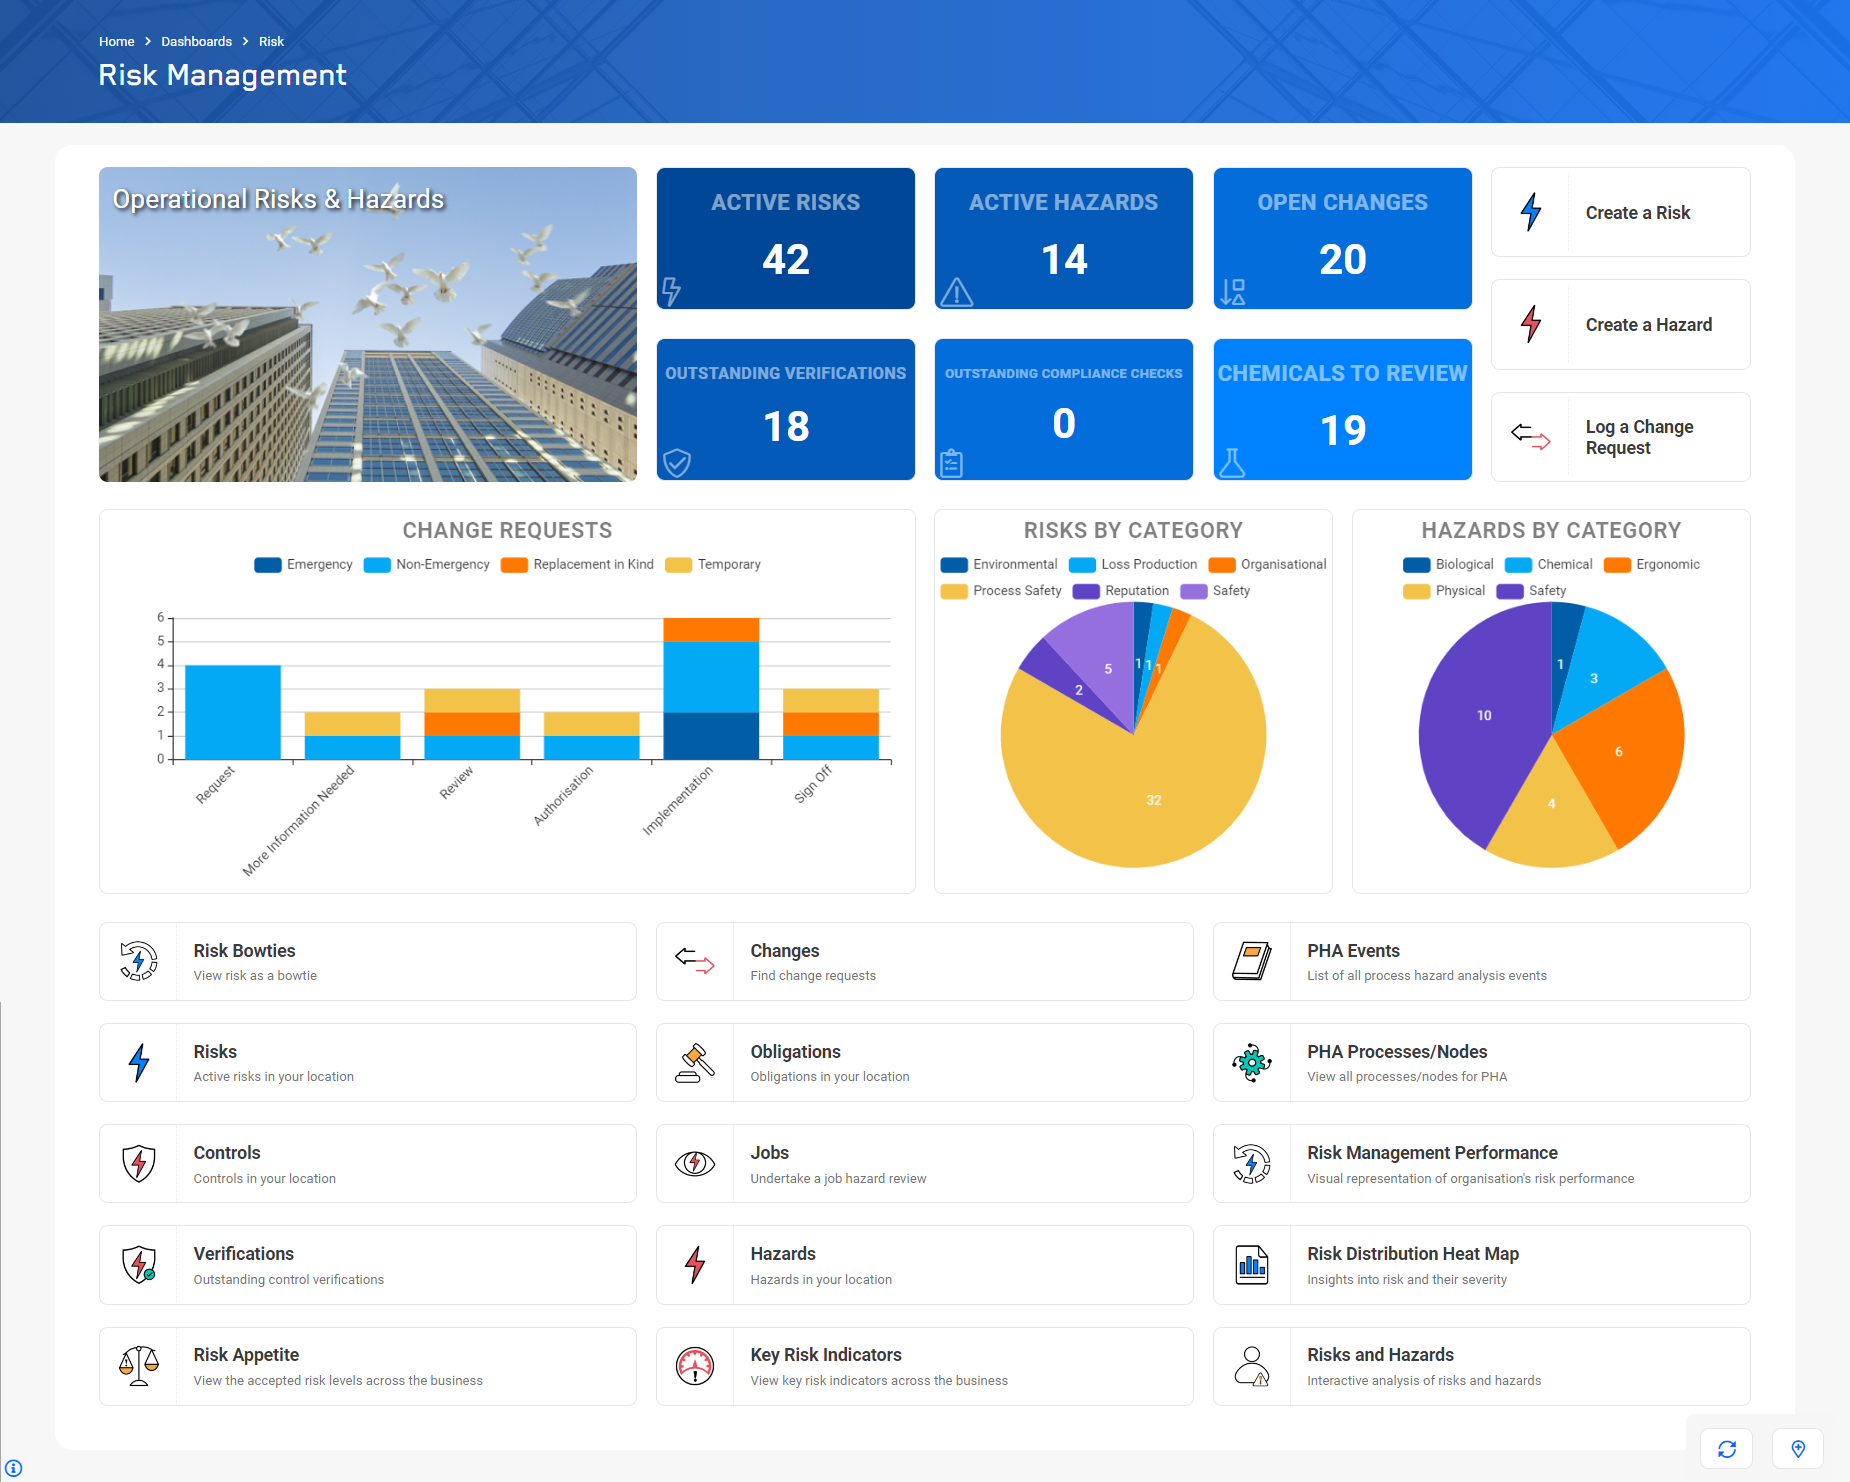
Dashboards, like the example below of the Web Application, are a collection of Links, Reports and Charts/Visualizations. They are highly configurable, so their content and layout can vary widely.

Dashboards
|
For the task of ...
|
I need to ...
|
Accessing a Dashboard via the Menu
|
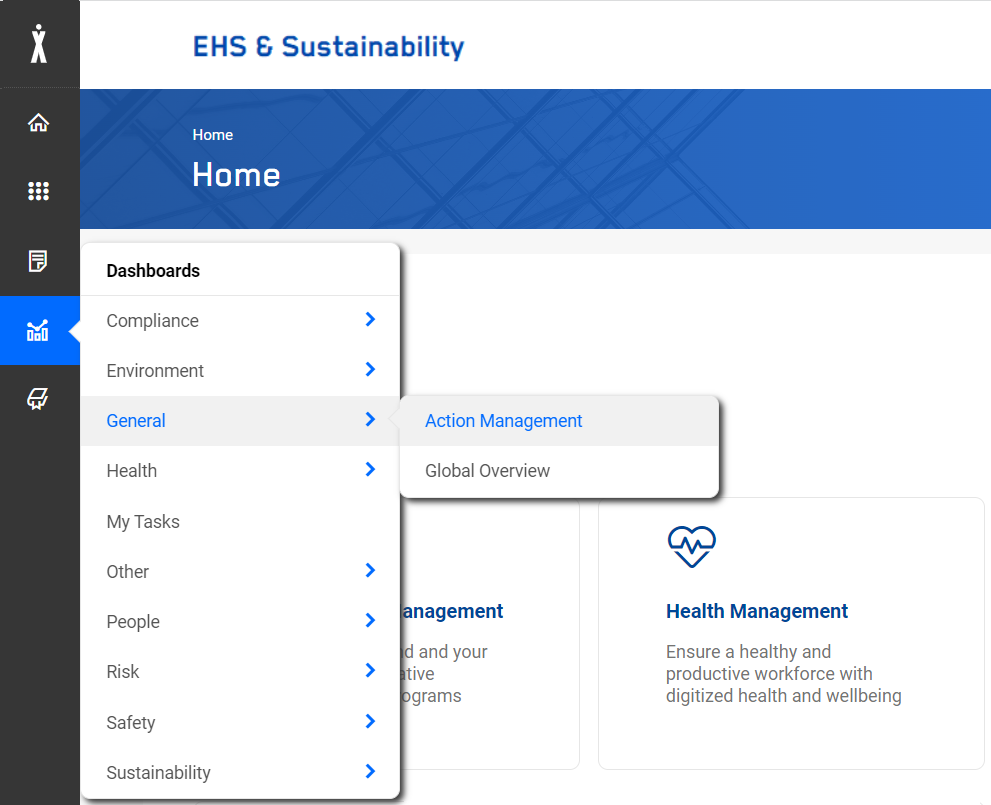
- Select "Dashboards", and then click on the Dashboard you need to access:

- The system will open the selected Dashboard
|
Accessing a Link on Dashboard
|
Links on a Dashboard behave like any other hyper-link - clicking on it will take you to the selected target.
The targets can be:
- List Views
- Creation of a new record
- Reports
- Other Dashboards
- External Links
NOTE:
Since it is possible to define BI Reports as a Link, clicking on them will also take you to the target.
|
Working with a Dashboard map
|
Dashboard Maps can be used to represent records, which can be linked to a geolocation, as pin on a map.
You can interact with these maps as follows:
- All maps have a left hand panel. Depending on the setup of each map, these panels may be initially expanded or hidden.
You can expand/collapse these panels via the > or < icons. - If no pins are displayed (which is the default setting for maps opening with an expanded panel), you must first select each of the 'map elements' which shall be rendered.
- If filters have been defined, you can apply a filter by selecting the required filter value(s) from the controls provided.
- If pins are too close together to be rendered individually at the current zoom level, they are represents as "clusters".
Each cluster will display a number, representing the number of pins which are grouped in that cluster.
By clicking on a cluster, the map will zoom into that region, revealing individual items under this cluster. These can be pins, but also further clusters. - Panning, zooming and searching for locations using the usual Google controls
- Once the maximum Zoom in has been reached, clicking on a pin or a cluster will give you some summary information about the underlying record(s).
- Clicking on a pin will take you to the underlying record.
|
Directly accessing a Dashboard via "Smart URL"
|
Reports can be directly accessed from outside the application by using the "Smart URL" functionality, for example:
http://server-name:8080/NetForms/dashboard/Open-Actions-Calendar
These URLs can be contained in an email, or they also can be used as Bookmarks in your Browser.
|
|

