|
Sustainability Questionnaire
Sustainability Questionnaire is a personalized data entry portal for end user to streamline the data entry and provide insights on their data collection progress.
The Charts and the Progress (%) displayed in the Questionnaire data entry portal is specific to the user’s progress in their personal data entry requirements and not an indication of Campaign’s overall data collection progress.
The items are filtered and will only show Metrics
- for Campaigns and Time Periods which are still open
- where the current user is responsible for providing the required Metric information, as defined in each Campaign.

|
NOTE:
When the Review Process is enabled, data currently in status "In Review" will be available in the Questionnaire as outstanding data until it is approved.
|
The Questionnaire provides the following functionalities
|
Feature
|
Explanation
|
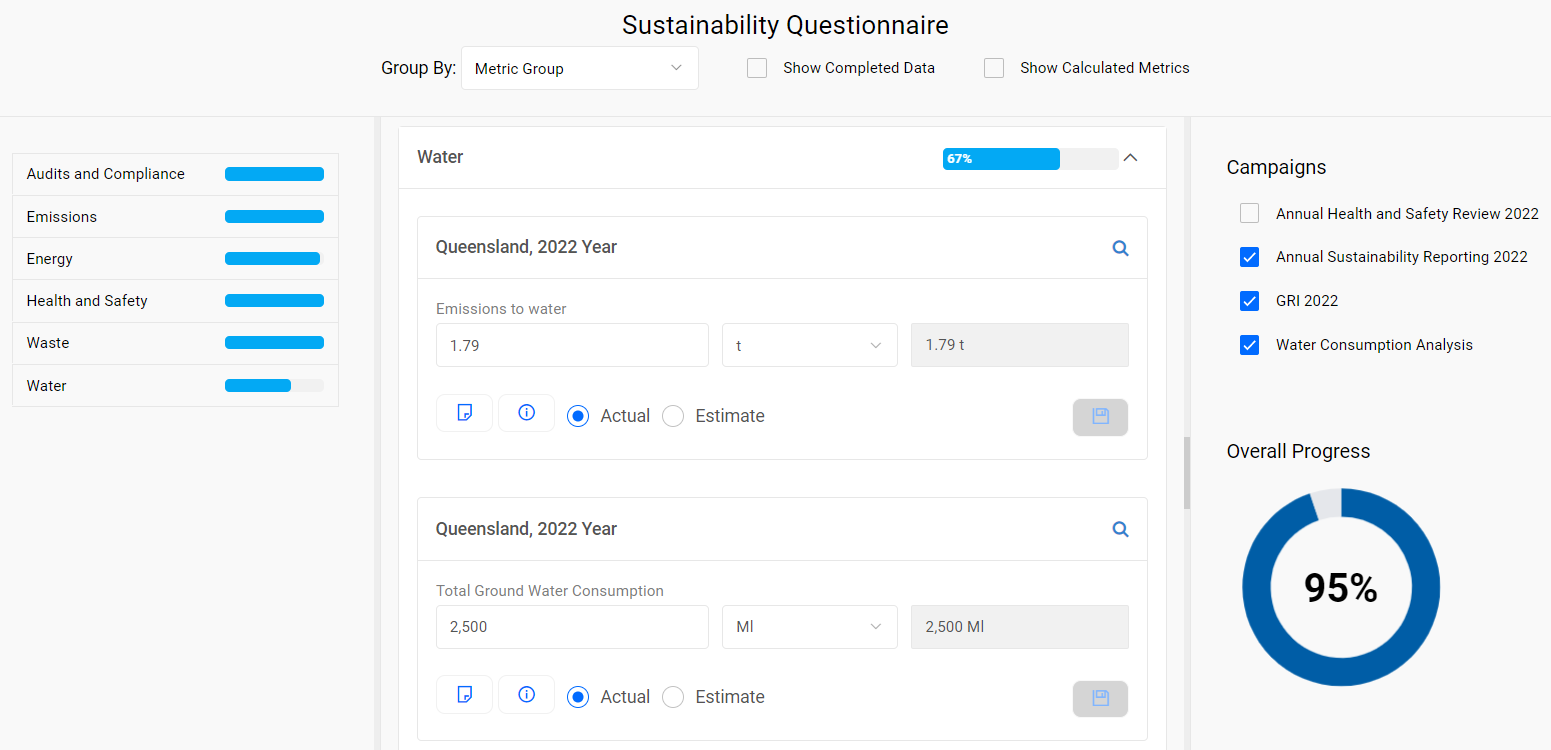
Group
|
The left panel will dynamically list the Group Headers and display a Progress Bar for each Header, indicating the level of completeness for each Group.
The Headers can also be used to directly navigate to the selected Group.
The user can Group the entries by the following:
- Location
- Time Period
- Metric Group
- Metric
- Company
|
Filtering
|
- Show Completed Data
Ticking 'Show Completed Data' option will allow users to view existing data. It will not affect the overall progress chart or the progress of the groups.
Where the Review process is not enabled, once the user enters the metric data, it will be considered as complete.
When the Review process is enabled, once the user enters the data and it has been approved by the reviewer (i.e. Review Status is set to 'Approved'), the metric data will be considered as complete.
- Show Calculated Metrics
Ticking 'Show Calculated Metrics' option will allow users to view both Calculated and Formula metrics. It will not affect the overall progress chart or the group progress bars.
|
Data Entry Panel
|
The main panel is used to
- view and enter your data
- attach files
- view up to 4 previous answers/values for each Metric and add comments
- Select Actual or Estimate for your result (defaulted to Actual)
|
Campaign Progress Panel
|
The Campaign progress panel on the right
- lists currently open Campaigns selecting which will show the Metrics related to that Campaign.
- indicates the Overall Data Collection Progress for the Campaigns selected in the (above) selection box.
|
Color Scheme
The default coloring used for the Progress Indicators can be modified by defining an Accent Color (see Global Settings).
|
