|
Evotix 360 Business Intelligence - what do I get?
Evotix 360 is a comprehensive suite of tools designed to enable companies to get real value from their data and make informed decisions. It includes:
- Reporting, graphing and dashboard tools that provides improved visualization of data so that decision makers can focus on vital information and make smart decisions quicker.
- Interactive data discovery and analysis tools providing business users with ability to slice and dice, drill down and pivot data in a number of ways to gain a deeper and more insightful understanding of information.
- Data integration tools to enable reporting across all modules and other external sources. This allows businesses to get more comprehensive reports while reducing time, resources and costs associated with collecting and analyzing data across a number of sources.
Richer Reporting Experience
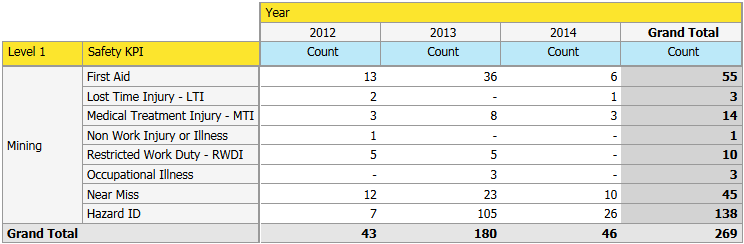
- Analysis Reports:
existing reports can be manipulated, so that for example the information can be shown either as a table, or as a graph. You can drill down on information, or you can exclude information which currently is not relevant for the user. All this can be done without affecting other users who may use the same report.
Report shown as Table:
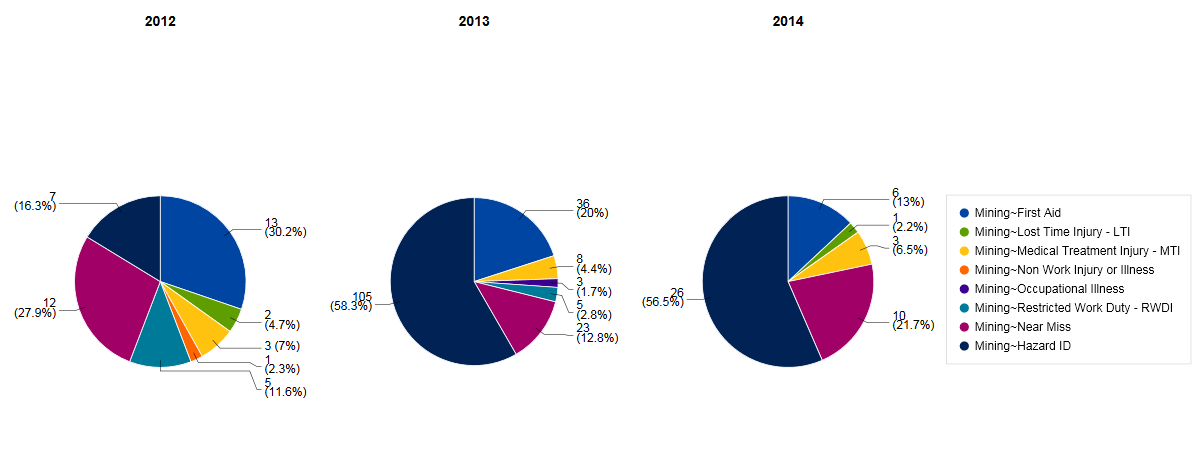
Same Report shown as a Graph:
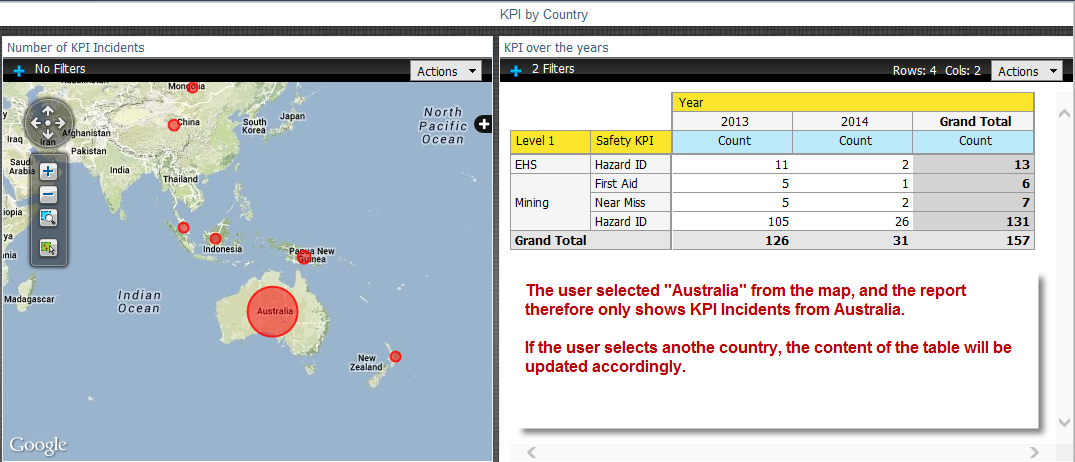
- Maps:
as long as a piece of information is linked to a location, you can place this information onto a map.
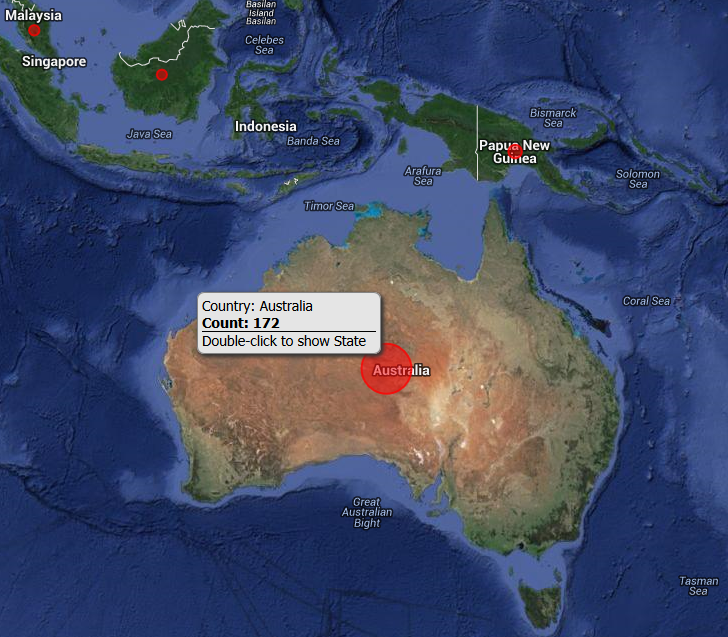
If you are using Roam (Version 3 and later), events which are captured with a mobile device will have the current geolocation attached to their record - and therefore they can be placed and evaluated on a map.
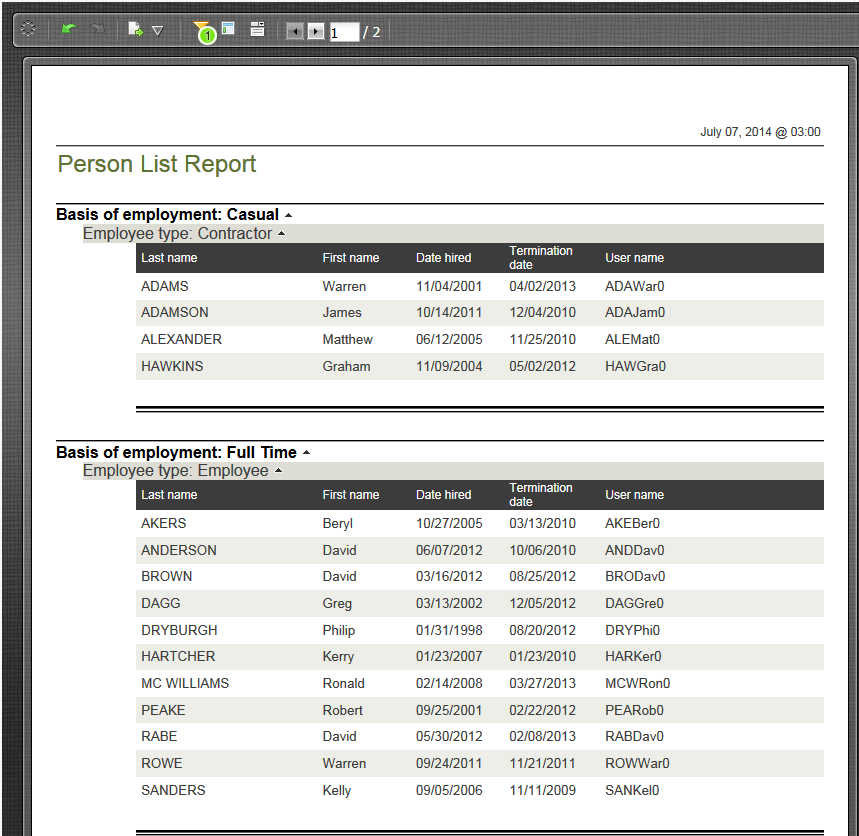
- Interactive Reports:
in Interactive Reports, users can perform actions like adding fields, defining groups and defining filters. These reports are used to represent more text based tabular data, for example a List of Persons in the system, or Incidents Grouped By Department and Person Reporting.
Please note that Interactive Reports have limited capabilities, especially in the areas of
- data security
- representing related data.
- Dynamic Dashboards:
BI Dashboards are a "collection" of several reports and graphs. These reports and graphs can be interactive as mentioned above, but also have the options to:
- Use Prompts, which act as a parameter on all, or some of the reports on the Dashboard.
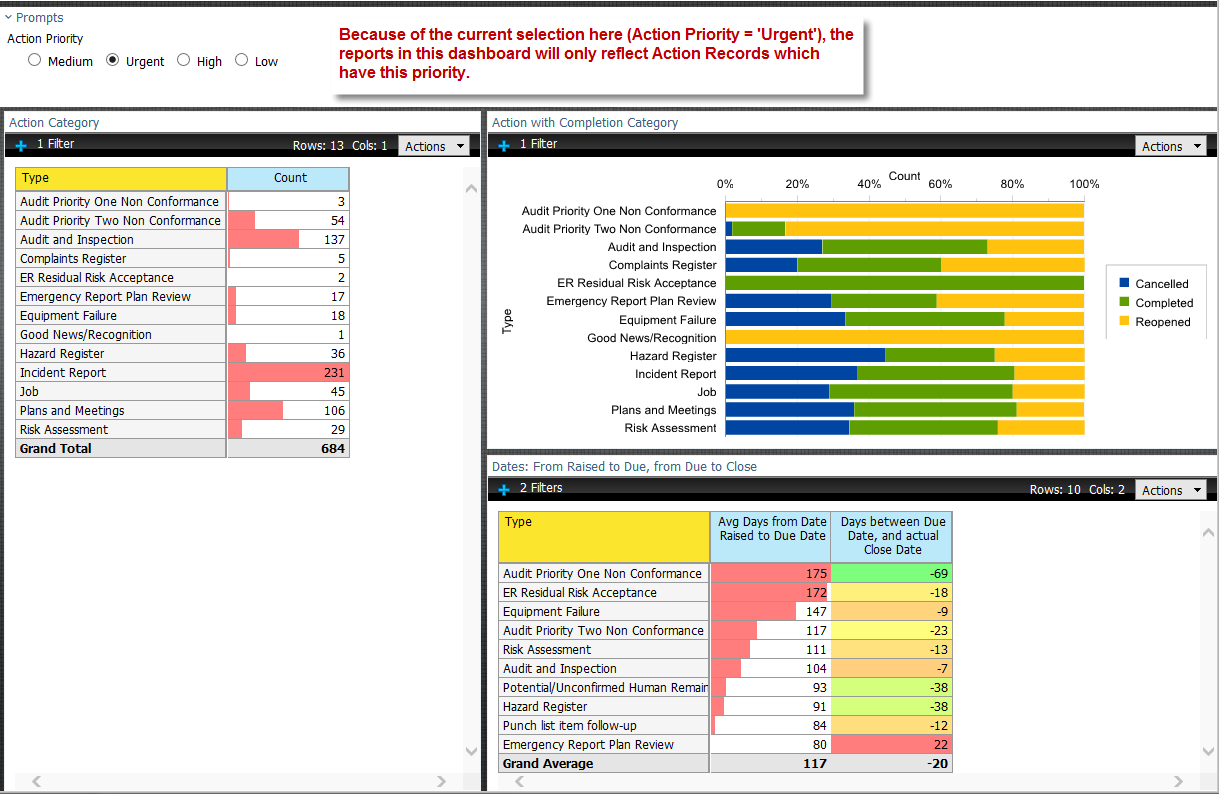
- Link reports to each other, meaning that a selection in one of the reports will directly influence the content of other reports on the same dashboard.
- More comprehensive "complex" Reports:
the Reporting Tool also includes a solution for more complex reporting requirements, which require for example detailed formatting, or are composed from various data sources.
These reports can include tabular information, as well as graphs and images if so required.
Add hoc Reporting
- "Cubes" as basis for Ad-hoc reporting
The introduction of data cubes allows users to perform quick and easy ad-hoc reporting, enabling them to "drag and drop" bits of information onto a canvas, and arrange the information in such a way that the user can analyze the data as required.
This also includes drill-downs, or "slicing and dicing" of data.
- Exporting Options
Depending on the report type, most reports can be exported and saved in a range of formats, including PDF and Excel.
|
