"Data Warehouse", "Data Cubes" - and their Use

It is important to know that all the data analysis in the BI tool is based on information which is:

  • Extracted from the Evotix 360 database
  • Transformed into a structure which allows easier reporting
  • Loaded into a Data Warehouse
  • and (in parts) is converted into a Data Cube/Schema.

The first three steps are referred to as an ETL process: Extract - Load - Transfer.

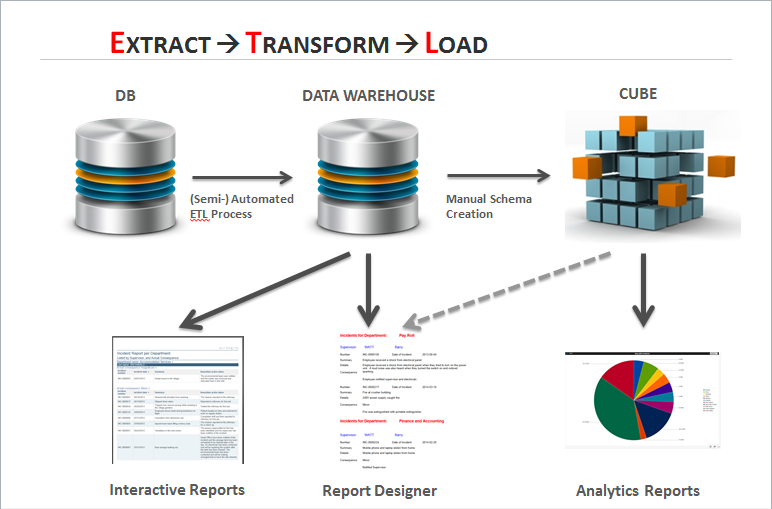
Both the Data Warehouse, and the Cube(s) will be used as the data source for data analysis, as shown in this illustration:

ETL Process Diagram

Creating the Structure of the Data Warehouse

Extracting the data out of Evotix 360, transforming them and loading the data into the Data Warehouse is a (semi-) automated process.

What this means is that either no, or only little manual intervention will be necessary to (re-)define the structure of the Data Warehouse when

  • applying this ETL process to different client databases.
  • making configuration changes to an existing database

The two main reasons for performing this step are:

  • the Data Warehouse is the basis upon which the Cubes are being built.
  • the database tables, views and columns will have "human readable" names, for example "rt_incident" as a view name, or "actual_consequence" as a column.

Both of these will greatly facilitate data analysis with the BI tool when creating Interactive Reports, or when creating reports with the Report Designer.

Creating the Structure of the Data Cube/Schema

The system will automatically create Standard Cubes for those Components which have been selected for reporting. These standard cubes are basic, but will provide sufficient information for some complex analysis.

These Standard Cubes will contain the following:

  • Measures:

    - Count of the Number of Records in a Component

    - Count of Related Records

    - Sum of any Integer Fields

  • Dimensions

    - Date (Year, Quarter, Month, Day)

    - Single Lookups

    - Relationships when the related Component is a rollup

Creating additional Schemas for the Data Cubes will be a manual process, since these Cubes will need to be tailored to each clients requirements for more detailed or in depth data analysis.

The presentation of data as Cubes is the base for the Analytics Reports, which allow actions like the following:

  • Slicing: cutting a slice out of the cube
  • Dicing: simultaneous slicing in several dimensions - creating a "sub-cube" of the original cube.
  • Pivoting: turning of the cube, which can reveal other dimensions.
  • Drill-Down: break down aggregates into more detailed values ("Zoom in").
  • Drill-Up: opposite of above
  • Drill-Across: evaluate a neighboring dimension (for example a different Month, or different Incident Type)
  • Drill-Through: refining to the highest level of details, i.e. the base record.

Feeding the Data from Evotix 360 into the Data Warehouse

Since the BI tool is relying on the Data Warehouse for reporting, it is necessary to periodically "copy" the data from Evotix 360 into the Data Warehouse.

This process is fully automated, and

  • will be set up during the project phase of an implementation.
  • can be modified at any time later.

The frequency of the updates will depend on the need for "up-to-date" information, and the amount and complexity of the data involved, and can vary

  • from every few minutes
  • to a couple of times a day.

In This Section

Making Evotix 360 Data available in the Data Warehouse

The ETL Process - defining BI Names and Natural Keys

Potential Impacts of Configuration Changes to the Data Warehouse in existing Systems

About the Size of the Data Warehouse Database

See Also

Business Intelligence

Evotix 360 Business Intelligence - what do I get?

From an Administrator's and Designer's Perspective

Business Intelligence Reports for "Consumers"