|
Adding a Map to a Dashboard: Map Widget
A Dashboard Map is a way to view records, from across multiple modules, with multiple filtering criteria, on a single dashboard Map widget.
Dashboard Maps are focused on finding and viewing individual records on a map, as an entry point to drill through to detailed records.

|
Prerequisites
- To use Map fields in the Web Application, a Google API Key that has the 'Places' suite of APIs enabled must be entered into Global Settings.
- Components must be set up for Geo Location, with each record having a Latitude and Longitude value.
|
Defining the Dashboard Maps
In a first step it is necessary to define the Dashboard Maps. These are the objects which then can be added to a Dashboard Widget.
From the menu, select Designer  Dashboards Dashboard Map Dashboards Dashboard Map
Dashboard Map Properties
|
For the task of ...
|
I need to ...
|
Naming the Map
|
Define the Map Name
|
Adding the individual Map Elements
|
Each Dashboard Map can have one or several Map Elements. These are the items which will be represented as Pins on the Map Widget.
Tab Map Elements:
- Define the Map Element Name. This name will be used on the map's filter panel legend.
- Select the Component which will be represented as a Pin on the Map, and then Save the record.
Tab Additional Details
- Select and link the fields for Latitude and Longitude.
All the remaining fields are optional
Icon URL
Each record on a map is represented as a pin. To replace the default red pin used by Google for a Map Element, you can do so by providing a URL to any public facing image file. For example:
http://maps.google.to/mapfiles/ms/micons/caution.png
 Prerequisite: the URL provided must be publicly accessible on the internet. Prerequisite: the URL provided must be publicly accessible on the internet.
Here are some sites which could be used to retrieve suitable icons:
- http://kml4earth.appspot.com/icons.html
- http://tancro.e-central.tv/grandmaster/markers/google-icons/mapfiles-ms-micons.html
- https://sites.google.com/site/gmapicons/
- https://img.icons8.com
Applying Filters to Map Elements
There are two different means to apply a filter to Map Elements:
- Static, using the Component Filter:
this filter will apply to all users, and it cannot be disabled/modified during run-time.
- Dynamic, using Filter Selection 1/2
Designers can define on which relationship a user can filter, and at run-time users have the option
- to apply this filter or not (by leaving the selection empty)
- to select a value to filter by (for example by selecting a Department or Location)
Component Filter
For each of the Map Elements, you apply any existing Component Filter, for example to only include "Incidents that occurred in the last 7 days" on a map.
Filter Selection 1/2
Designers can select any relationship on which a filter should be applicable.
When such filters have been provided, users will be able to dynamically filter the content of a map by selecting a value from the referred component at run-time.

|
Dashboard Maps with multiple Widgets
For the filters to work correctly it is required that, within a given Dashboard Map, the relationships selected for the Filter Selections 1/2 are the same across all Map Elements .
Should there be a breach of that rule, the web application will issue a Publish Warning.
|
|
Tooltip Summary at Runtime
At runtime, the system will display a tooltip summary when users click on a pin or cluster. When clicking on the summary, the system will open the corresponding record.
- The fields which are shown on that summary are determined by the List View used as the Default Component Lookup for the Component.
- It is the Form which is linked to this List View which will be opened when the user accesses a record from the Tooltip Summary.
|
|
Defining a Map Widget
The Properties for the Map Widget are:
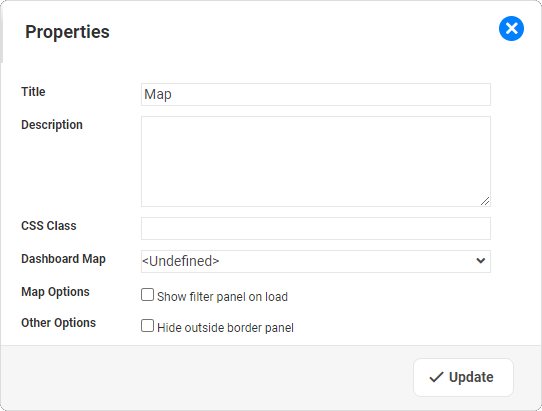
Map Widget Properties
|
For the task of ...
|
I need to ...
|
Defining the Title for this Widget
|
Update the Title
|
Adding a Description of this Widget.
|
Update the Description (optional)
|
Applying a specific style to the widget
|
A CSS Class can be used by Designers to apply specific CSS to the widget, enhancing the ability to individually style widgets.
|
Selecting the Dashboard Map
|
Select the Dashboard Map from the available list of Maps.
|
Controlling if the Filter Panel is shown or hidden on load
|
Map Option "Show filter panel on load":
- If selected,
- the Dashboard map will load with the filter panel being expanded
- the system will not initially load any records onto the map, waiting for the user to toggle a Map Element "on" - If not selected,
- that panel will be collapsed upon loading
- the system will load all Map Elements by default  - Regardless of the selection, Users will have the option to show/hide the panel, and toggle Map Elements on/off.

|
Performance Considerations
Opting to hide the filter panel will cause all Map Elements to be loaded, including all the filters and security evaluation that go along with them – so in some cases this could cause long load times
|
|
|
