By adding one or several Parameters to a Dashboard, users are able to filter the data in the current dashboard.
Visualization Parameter widgets provide selection fields on the dashboard, where end users can drive the filtering of all visualizations on the dashboard.
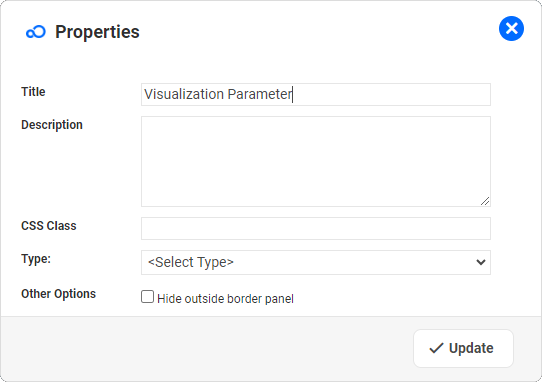
Visualization Parameter Widget Properties
|
For the task of ...
|
I need to ...
|
Defining the Title for this Widget
|
Update the Title
|
Adding a Description of this Widget
|
Update the Description (optional)
|
Applying a specific style to the widget
|
A CSS Class can be used by Designers to apply specific CSS to the widget, enhancing the ability to individually style widgets.
|
Selecting the Type of Parameter
|
Define the type of Parameter.
- Component
- Lookup List
- Date Range
- Questionnaire
If the Type is set to Component or Lookup, the system displays an option called 'Allow Multiple Selection', which lets users choose multiple parameter values when the parameter is rendered in the dashboard.
Refer to Visualizations for further details.
|
Defining the value of the Component
|
Select the Component which is to be used as the parameter, For example Department or Location.
|
Filtering the Selection
|
To apply a Filter, select one of the List Views offered by the web application. The system will then apply the filter which is linked to that List View.
If you leave the Filter field empty, then the system will apply the filter which may be linked to the Default Component Lookup.
|